The greatest WordPress.com site in all the land!

America, The Land of Milk and Honey
Backgrounder #1791
This is a Backgrounder On Taxes
Two Americas: One Rich, One Poor? Understanding Income Inequality in the United States
By Rea S. Hederman, Jr. and Robert RectorAugust 24, 2004
Class warfare has always been a mainstay of liberal politics. Politicians frequently depict the United States as a nation starkly divided between the rich and poor. For example, vice presidential candidate John Edwards decries “two Americas…one privileged, the other burdened…one America that does the work, another that reaps the reward. One America that pays the taxes, another America that gets the tax breaks.”1
How accurate is this characterization? How unequal is the distribution of economic resources in our society? This paper will attempt to answer these questions. Specifically, it will seek to provide:
Discussions of income distribution usually begin with annual data provided by the Census Bureau. To measure income distribution, the Census Bureau first ranks households from highest to lowest income. It then divides society into five groups, called quintiles, and determines the share of total income received by each quintile.3
On the surface, the Census figures appear lucid and easily understandable. However, the conventional Census data are marred by four problems that lead to an overstatement of the level of economic inequality:
The paper presents data on income distribution in four separate stages:
![]()
![]()
Despite this list, it is now widely acknowledged that the Census money income figures grossly underreport the economic resources available to the American people.6 For example, the aggregate “money income” figures reported by the Census in 1996 equaled only 70 percent of the comparable personal income figures reported in the Commerce Department’s National Income and Production Accounts (NIPA), which serve as the basis for measuring gross national product.7
Increasingly, Americans receive “non-cash” incomes that are not included in the Census income distribution figures based on “money income.” For example, many Americans receive health insurance from their employers. Such insurance is an important augmentation to salaries. Families who have health coverage are clearly better off, ceteris paribus, than those who must pay health costs out of pocket.
Similarly, the poor and the elderly receive extensive and costly non-cash benefits from the government. In 2002, the government spent $522 billion on means-tested aid to the poor and the near poor.8 This aid included cash, food, housing, medical care, and social services such as subsidized day care. Virtually none of this assistance was included in the Census income distribution figures. In the same year, the government spent $257 billion subsidizing medical care for the elderly through the Medicare program; this assistance was also ignored in the Census income distribution figures.
The social safety net represents a massive transfer of economic resources away from affluent families and toward the less affluent. Each year, the government taxes higher-income families and transfers economic resources to the poor and elderly through means-tested welfare and Medicare. Overall, the resources transferred in this manner are over $750 billion per year, or more than 8 percent of total personal income. Yet almost none of this massive redistribution of economic resources is recorded in the conventional Census income distribution figures shown in stage 1.
Fortunately, the Census Bureau’s annual Current Population Survey (CPS) collects data on taxes and on the receipt of many additional types of income beyond those included under “money income.” While these additional income data are excluded from the Census’ conventional (stage 1) income distribution figures, which are based on “money income” only, they are available to researchers in electronic form. We have used these excluded data as the basis for the analyses provided in this paper.9
Table 1 shows the effects of incorporating a more complete count of income and taxes on the distribution of income. Adjustments to income are presented in sub-stages. First, capital gains and losses are added (stage 2A). This adjustment raises total annual income by some $320 billion and increases income inequality. Next, employee health benefits and government non-cash transfers are added (stage 2B). Government transfers include the earned income tax credit, food stamps, school lunch programs, public housing, Medicaid, and Medicare. Medicaid and Medicare benefits are counted at their insurance or market value, which equals the average government expenditures on benefits to individuals in specific age and risk categories. These adjustments add nearly $700 billion to the total annual income and decrease income inequality. Finally, the effects of federal income tax, state income tax, and Social Security taxes are shown in stage 2C. This adjustment reduces annual total income by some $1.4 trillion and markedly decreases inequality. We term the income figures in stage 2C “comprehensive post-tax income.”10
![]()
Inclusion of taxes and non-cash aid substantially reduces economic inequality. In stage 1, the bottom quintile was shown to have 3.5 percent of total income; by stage 2C, this number had risen to 5.35 percent. The income share of the top quintile falls from 49.6 percent in stage 1 to 46.16 percent in stage 2C.
No one would think it valid to measure inequality between New York State and Delaware by simply comparing the aggregate incomes in the two states. In such a comparison, income differences would mainly reflect vast differences in state populations. But the Census makes precisely this sort of unbalanced comparison whenever it compares quintiles of unequal size.
Chart 3 shows the percent of the population contained within each Census “quintile.” While the middle quintile does contain roughly one-fifth of the population, the others do not. The high disparity in population between the highest and lowest income quintiles is of particular interest. The top quintile contains 24.6 percent of the population, but the bottom quintile contains only 14.3 percent. In raw numbers, there are 69.4 million persons in the top quintile compared to 40.3 million in the bottom. Thus, for every person in the lowest quintile there are 1.7 persons in the top quintile. This imbalance in population is a major factor contributing to the apparent levels of inequality in Census Bureau figures.
The Census Bureau quintiles are unequal in size because they are based on a count of households rather than persons. A household is defined as a person or group of persons living in a single housing unit. In the United States, high-income households tend to be married couples with many members and earners. Low-income households tend to be single persons with little or no earnings. Thus, it should be of no surprise that the average household in the Census’ top quintile contains 3.2 persons, while the average household in the bottom quintile contains 1.8 persons.
The typical Census practice of measuring inequality by comparing aggregate incomes between “quintiles” that contain widely differing numbers of persons can be extremely misleading. To a considerable degree, the relative poverty of the Census’ official bottom quintile shown in Chart 1 results from the simple lack of people within the quintile rather than from economic factors.
A far clearer picture of income inequality can be obtained by adjusting the quintiles so that each actually contains 20 percent of the population. In Chart 4, incomes have been corrected to include taxes and non-cash benefits, and the quintiles are adjusted to contain equal numbers of persons. As a result, the income share of the bottom quintile rises to 9.4 percent of total income and the share of the top quintile falls to 39.6 percent.
![]()
![]()
In many respects, economic inequalities between the quintiles are a direct reflection of disparities in work performed. Chart 5 reverts to the conventional Census quintiles with unequal numbers of persons. The chart shows the total annual hours of paid labor in each quintile. In 2002, individuals in the bottom quintile performed 4.3 percent of all the work in the U.S. economy, while those in the top quintile performed 33.9 percent. Thus, the top quintile performed almost eight times as much labor as did the bottom quintile.
In part, the low levels of paid employment in the bottom quintile reflect the low numbers of working-age adults (ages 18 to 64) within the group. In the conventional Census figures (with unequal quintiles), the bottom quintile contains only 11.2 percent of all working-age adults, while the top quintile contains 27.6 percent. Not only does the bottom quintile contain fewer adults of working age, but each adult, on average, works fewer hours during the year than does his counterpart in the higher-income quintiles. On average, working-age adults in the bottom quintile worked about half as many hours during the year as did adults in the top quintile. The combination of relatively few working-age adults and low levels of work per adult contributes significantly to the low income levels in the bottom quintile.
The stage 4 analysis shows what the distribution of income would be if working-age adults in the bottom quintile worked as many hours as those in higher-income families. In contrast to the adjustments in stages 2 and 3, stage 4 represents a hypothetical rather than an actual condition, since the non-elderly adults in the bottom quintile clearly do not work as much as higher-income adults.
The stage 4 figures incorporate the adjustments made in stages 2 and 3 before making the hypothetical adjustments in hours of work. The results are presented in Chart 6. The working-age adults in each quintile are assumed, on average, to perform equal hours of paid labor during the year. The outcome would be a substantial equalization of incomes. The income share of the bottom quintile would rise to 12.3 percent, while that of the top quintile would fall to 35.8 percent.
Ratio of Incomes Between the Top
Chart 7 summarizes the ratios of income of the top quintile compared to the bottom quintile in various scenarios. In the conventional figures from stage 1, households in the top quintile appear to have, on average, $14.30 of income for each $1.00 of income in the bottom quintile. When the impact of taxes and non-cash benefits is included in stage 2, the ratio falls to $8.60 in the top for each $1.00 in the bottom. If the quintiles are then corrected to contain equal numbers of persons, the ratio falls to $4.21 to $1.00. Finally, if the annual work levels of working-age adults in each quintile were hypothetically made equal, the income ratio of the top to the bottom would fall to $2.91 to $1.00.
![]()
![]()
The conventional Census figures also suggest that the incomes of the two poorest quintiles have fallen over the past 30 years. The Census reports that in 1970, the two poorest quintiles had 14.9 percent of all money income. By 2002, the figure had fallen to 12.3 percent. However, this apparent decline is a result of the exclusion of non-cash benefits from the count of income. Means-tested welfare and Medicare has risen greatly over time, from 1.5 percent of total personal income in 1950 to over 8 percent in 2002. If these benefits were properly included in the income count, the income share of the two poorest quintiles would be shown to have risen considerably in the 1960s and to have remained relatively unchanged over the past 30 years.
![]()
![]()
![]()
However, these figures are flawed by the exclusion of taxes and social safety net spending and by the fact that the “fifths” do not contain equal numbers of people. Adjustment for these factors radically alters the picture of income distribution: The top fifth of the population has $4.21 of income for every $1.00 at the bottom.
The remaining inequality in society is heavily influenced by the lack of work at the bottom. If working-age adults in the lower quintiles worked as much as their higher-income counterparts, the income disparity of the top to the bottom quintiles would fall to $2.91 to $1.00.
Still, the top fifth of U.S. households (with incomes above $84,000) remain perennial targets of class-warfare enmity. These families, however, perform a third of all labor in the economy. They contain the best educated and most productive workers, and they provide a disproportionate share of the investment needed to create jobs and spur economic growth. Nearly all are married-couple families, many with two or more earners. Far from shirking the tax burden, these families pay 82.5 percent of total federal income taxes and two-thirds of federal taxes overall. By contrast, the bottom quintile pays 1.1 percent of total federal taxes.12
In one sense, John Edwards is correct: There is one America that works a lot and pays a lot in taxes, and there is another America that works less and pays little. However, the reality is the opposite of what Edwards suggests. It is the higher-income families who work a lot and pay nearly all the taxes. Raising taxes even higher on hard-working families would be unfair and, by reducing future investments, would reduce economic growth, harming all Americans in the long run.
Robert Rector is Senior Research Fellow in Domestic Policy Studies, and Rea S. Hederman, Jr., is a Senior Policy Analyst in the Center for Data Analysis, at The Heritage Foundation.
Methodological Appendix
This paper examines the distribution of income and income inequality with data extracted from the Current Population Survey for the year 2002, conducted in March 2003. Like the Census Bureau, this paper studies income at the household level. Group quarters are not included in this survey. The authors also used data extracted from the Heritage Income Tax Model, which contains a sample of actual tax returns designed to replicate the total tax returns received by the Internal Revenue Service. In general, this study does not account for the underreporting of income to the Census Bureau.
Comprehensive post-tax income is very similar to the Census income “definition 14″ as detailed in the Census Bureau’s Current Population Reports, Income, poverty and Valuation on Noncash Benefits, except that it employs the basic market or insurance value for Medicaid and Medicare without the “fungible” adjustment.13 The insurance value of Medicaid and Medicare (also called the market value) equals the average net government outlay for persons of a specific risk class within a given state. The risk classes used are elderly, disabled persons, non-disabled adult, and non-disabled child. Under this approach, the value of Medicaid or Medicare equals the average cost to the government of medical services provided to a given class of persons; it does not report specific medical expenditures for particular individuals.
The fungible method of valuing Medicare and Medicaid begins with the insurance value of benefits but then alters the values based on the family’s income class. The full insurance value is assigned to benefits received by the middle class, but a lower value or zero value is assigned when the same benefits are received by a low-income household. The fungible adjustment was devised for the measurement of poverty, not income distribution. In measuring poverty, it is used to determine whether a household’s income should be considered above the poverty threshold. However, the fungible adjustment, which deliberately reduces the value of benefits received by low-income groups, is not appropriate for the measure of income equality that seeks to compare the economic resources of one household relative to others. The fungible adjustment results in a substantial undercounting of government transfers to low income groups.
How accurate is this characterization? How unequal is the distribution of economic resources in our society? This paper will attempt to answer these questions. Specifically, it will seek to provide:
- A clearer understanding of the existing level of income equality in U.S. society, and
- An appreciation of the social and economic forces contributing to existing inequality.
Census Figures on Income Distribution
This paper analyzes the existing distribution of income in the United States. The term “income” refers to new revenues and economic resources received by individuals and families during the course of a year.2 The distribution of annual income is thus distinct from the distribution of wealth, which refers to economic assets saved from prior years.Discussions of income distribution usually begin with annual data provided by the Census Bureau. To measure income distribution, the Census Bureau first ranks households from highest to lowest income. It then divides society into five groups, called quintiles, and determines the share of total income received by each quintile.3
On the surface, the Census figures appear lucid and easily understandable. However, the conventional Census data are marred by four problems that lead to an overstatement of the level of economic inequality:
- Conventional Census income figures are incomplete and omit many types of cash and non-cash income.
- The conventional Census figures do not take into account the equalizing effects of taxation.
- The Census quintiles actually contain unequal number of persons, a fact that greatly magnifies the apparent level of economic inequality.
- Differences in income are substantially affected by large differences in the amount of work performed within each quintile, yet these differences in work effort are rarely acknowledged.
An Accurate Picture of the Distribution of Economic Resources
This paper analyzes the distribution of income in the United States based on data taken from the Census Bureau’s Current Population Survey (CPS) from March 2003 (covering incomes for 2002).4 Income distribution data change very little from one year to the next; therefore, the conclusion reached in this paper would apply with little change for incomes in 2003.The paper presents data on income distribution in four separate stages:
Stage 1: Conventional Income Distribution Data
As noted, the Census presents income distribution by dividing U.S. households into five groups or quintiles. The share of total income going to each quintile is then determined. The conventional quintile distribution of income for 2002 is shown in Chart 1. In that year, the Census reported that the top or most affluent quintile had 49.7 percent of income, while the bottom quintile had only 3.5 percent. Thus, the top fifth of households is shown to have 14.3 times more income than the bottom fifth.5

Stage 2: Impact of taxes and Non-Cash Benefits on Economic Equality
The conventional Census income distribution data are based on the concepts of “money income.” Money income includes earnings, interest, dividends, rents, Social Security retirement benefits, pension or retirement income, survivors’ benefits, disability benefits, veterans’ benefits, workers’ compensation, alimony, and some cash welfare benefits.Despite this list, it is now widely acknowledged that the Census money income figures grossly underreport the economic resources available to the American people.6 For example, the aggregate “money income” figures reported by the Census in 1996 equaled only 70 percent of the comparable personal income figures reported in the Commerce Department’s National Income and Production Accounts (NIPA), which serve as the basis for measuring gross national product.7
Increasingly, Americans receive “non-cash” incomes that are not included in the Census income distribution figures based on “money income.” For example, many Americans receive health insurance from their employers. Such insurance is an important augmentation to salaries. Families who have health coverage are clearly better off, ceteris paribus, than those who must pay health costs out of pocket.
Similarly, the poor and the elderly receive extensive and costly non-cash benefits from the government. In 2002, the government spent $522 billion on means-tested aid to the poor and the near poor.8 This aid included cash, food, housing, medical care, and social services such as subsidized day care. Virtually none of this assistance was included in the Census income distribution figures. In the same year, the government spent $257 billion subsidizing medical care for the elderly through the Medicare program; this assistance was also ignored in the Census income distribution figures.
The social safety net represents a massive transfer of economic resources away from affluent families and toward the less affluent. Each year, the government taxes higher-income families and transfers economic resources to the poor and elderly through means-tested welfare and Medicare. Overall, the resources transferred in this manner are over $750 billion per year, or more than 8 percent of total personal income. Yet almost none of this massive redistribution of economic resources is recorded in the conventional Census income distribution figures shown in stage 1.
Fortunately, the Census Bureau’s annual Current Population Survey (CPS) collects data on taxes and on the receipt of many additional types of income beyond those included under “money income.” While these additional income data are excluded from the Census’ conventional (stage 1) income distribution figures, which are based on “money income” only, they are available to researchers in electronic form. We have used these excluded data as the basis for the analyses provided in this paper.9
Table 1 shows the effects of incorporating a more complete count of income and taxes on the distribution of income. Adjustments to income are presented in sub-stages. First, capital gains and losses are added (stage 2A). This adjustment raises total annual income by some $320 billion and increases income inequality. Next, employee health benefits and government non-cash transfers are added (stage 2B). Government transfers include the earned income tax credit, food stamps, school lunch programs, public housing, Medicaid, and Medicare. Medicaid and Medicare benefits are counted at their insurance or market value, which equals the average government expenditures on benefits to individuals in specific age and risk categories. These adjustments add nearly $700 billion to the total annual income and decrease income inequality. Finally, the effects of federal income tax, state income tax, and Social Security taxes are shown in stage 2C. This adjustment reduces annual total income by some $1.4 trillion and markedly decreases inequality. We term the income figures in stage 2C “comprehensive post-tax income.”10

Inclusion of taxes and non-cash aid substantially reduces economic inequality. In stage 1, the bottom quintile was shown to have 3.5 percent of total income; by stage 2C, this number had risen to 5.35 percent. The income share of the top quintile falls from 49.6 percent in stage 1 to 46.16 percent in stage 2C.
Stage 3: Adjustment of Quintiles to Contain Equal Numbers of Persons
When decision-makers, journalists, and the public view the government’s official income distribution figures, there is a common and implicit assumption that the quintiles contain equal shares of the population. After all, the notion that we should measure “inequality” by comparing the aggregate income of groups that are themselves unequal in size is at best confusing. However, as noted, the official Census income “quintiles” do not contain equal shares of the population, and this fact skews the Census’ measure of income distribution.No one would think it valid to measure inequality between New York State and Delaware by simply comparing the aggregate incomes in the two states. In such a comparison, income differences would mainly reflect vast differences in state populations. But the Census makes precisely this sort of unbalanced comparison whenever it compares quintiles of unequal size.
Chart 3 shows the percent of the population contained within each Census “quintile.” While the middle quintile does contain roughly one-fifth of the population, the others do not. The high disparity in population between the highest and lowest income quintiles is of particular interest. The top quintile contains 24.6 percent of the population, but the bottom quintile contains only 14.3 percent. In raw numbers, there are 69.4 million persons in the top quintile compared to 40.3 million in the bottom. Thus, for every person in the lowest quintile there are 1.7 persons in the top quintile. This imbalance in population is a major factor contributing to the apparent levels of inequality in Census Bureau figures.
The Census Bureau quintiles are unequal in size because they are based on a count of households rather than persons. A household is defined as a person or group of persons living in a single housing unit. In the United States, high-income households tend to be married couples with many members and earners. Low-income households tend to be single persons with little or no earnings. Thus, it should be of no surprise that the average household in the Census’ top quintile contains 3.2 persons, while the average household in the bottom quintile contains 1.8 persons.
The typical Census practice of measuring inequality by comparing aggregate incomes between “quintiles” that contain widely differing numbers of persons can be extremely misleading. To a considerable degree, the relative poverty of the Census’ official bottom quintile shown in Chart 1 results from the simple lack of people within the quintile rather than from economic factors.
A far clearer picture of income inequality can be obtained by adjusting the quintiles so that each actually contains 20 percent of the population. In Chart 4, incomes have been corrected to include taxes and non-cash benefits, and the quintiles are adjusted to contain equal numbers of persons. As a result, the income share of the bottom quintile rises to 9.4 percent of total income and the share of the top quintile falls to 39.6 percent.
Stage 4: Inequality of Income and Inequality of Work
Counting taxes and safety net benefits while balancing the quintiles to contain equal shares of the population dramatically transforms the picture of inequality in the United States. However, it is possible to probe the issue even further.

In many respects, economic inequalities between the quintiles are a direct reflection of disparities in work performed. Chart 5 reverts to the conventional Census quintiles with unequal numbers of persons. The chart shows the total annual hours of paid labor in each quintile. In 2002, individuals in the bottom quintile performed 4.3 percent of all the work in the U.S. economy, while those in the top quintile performed 33.9 percent. Thus, the top quintile performed almost eight times as much labor as did the bottom quintile.
In part, the low levels of paid employment in the bottom quintile reflect the low numbers of working-age adults (ages 18 to 64) within the group. In the conventional Census figures (with unequal quintiles), the bottom quintile contains only 11.2 percent of all working-age adults, while the top quintile contains 27.6 percent. Not only does the bottom quintile contain fewer adults of working age, but each adult, on average, works fewer hours during the year than does his counterpart in the higher-income quintiles. On average, working-age adults in the bottom quintile worked about half as many hours during the year as did adults in the top quintile. The combination of relatively few working-age adults and low levels of work per adult contributes significantly to the low income levels in the bottom quintile.
The stage 4 analysis shows what the distribution of income would be if working-age adults in the bottom quintile worked as many hours as those in higher-income families. In contrast to the adjustments in stages 2 and 3, stage 4 represents a hypothetical rather than an actual condition, since the non-elderly adults in the bottom quintile clearly do not work as much as higher-income adults.
The stage 4 figures incorporate the adjustments made in stages 2 and 3 before making the hypothetical adjustments in hours of work. The results are presented in Chart 6. The working-age adults in each quintile are assumed, on average, to perform equal hours of paid labor during the year. The outcome would be a substantial equalization of incomes. The income share of the bottom quintile would rise to 12.3 percent, while that of the top quintile would fall to 35.8 percent.
Ratio of Incomes Between the Top
and Bottom Quintiles
Chart 7 summarizes the ratios of income of the top quintile compared to the bottom quintile in various scenarios. In the conventional figures from stage 1, households in the top quintile appear to have, on average, $14.30 of income for each $1.00 of income in the bottom quintile. When the impact of taxes and non-cash benefits is included in stage 2, the ratio falls to $8.60 in the top for each $1.00 in the bottom. If the quintiles are then corrected to contain equal numbers of persons, the ratio falls to $4.21 to $1.00. Finally, if the annual work levels of working-age adults in each quintile were hypothetically made equal, the income ratio of the top to the bottom would fall to $2.91 to $1.00.

Increasing Inequality?
A frequent complaint is that the distribution of income is becoming less equal over time. There is some merit to this charge: According to conventional Census numbers, the income share of the top fifth of households rose from 43.7 percent of total income in 1980 to 49.7 percent in 2002. But nearly all of that increase occurred in the 1980s and mid-1990s. For the past five years, the distribution of income has remained static, as charts 8 and 9 show. A tiny increase in the income share of the top quintile corresponds to a small increase in the share of population and total work occurring within the quintile. After adjusting quintiles to contain equal numbers of persons, the top quintile in 1997 had $4.22 in post-tax, post-benefit income for every $1.00 of similar income at the bottom.11 In 2002, the ratio was $4.21 to $1.00.The conventional Census figures also suggest that the incomes of the two poorest quintiles have fallen over the past 30 years. The Census reports that in 1970, the two poorest quintiles had 14.9 percent of all money income. By 2002, the figure had fallen to 12.3 percent. However, this apparent decline is a result of the exclusion of non-cash benefits from the count of income. Means-tested welfare and Medicare has risen greatly over time, from 1.5 percent of total personal income in 1950 to over 8 percent in 2002. If these benefits were properly included in the income count, the income share of the two poorest quintiles would be shown to have risen considerably in the 1960s and to have remained relatively unchanged over the past 30 years.


Conclusion
The Census income distribution figures are the foundation of most class-warfare rhetoric. On the surface, these figures show a high level of inequality: The top fifth of households have $14.30 of income for every $1.00 at the bottom.However, these figures are flawed by the exclusion of taxes and social safety net spending and by the fact that the “fifths” do not contain equal numbers of people. Adjustment for these factors radically alters the picture of income distribution: The top fifth of the population has $4.21 of income for every $1.00 at the bottom.
The remaining inequality in society is heavily influenced by the lack of work at the bottom. If working-age adults in the lower quintiles worked as much as their higher-income counterparts, the income disparity of the top to the bottom quintiles would fall to $2.91 to $1.00.
Still, the top fifth of U.S. households (with incomes above $84,000) remain perennial targets of class-warfare enmity. These families, however, perform a third of all labor in the economy. They contain the best educated and most productive workers, and they provide a disproportionate share of the investment needed to create jobs and spur economic growth. Nearly all are married-couple families, many with two or more earners. Far from shirking the tax burden, these families pay 82.5 percent of total federal income taxes and two-thirds of federal taxes overall. By contrast, the bottom quintile pays 1.1 percent of total federal taxes.12
In one sense, John Edwards is correct: There is one America that works a lot and pays a lot in taxes, and there is another America that works less and pays little. However, the reality is the opposite of what Edwards suggests. It is the higher-income families who work a lot and pay nearly all the taxes. Raising taxes even higher on hard-working families would be unfair and, by reducing future investments, would reduce economic growth, harming all Americans in the long run.
Robert Rector is Senior Research Fellow in Domestic Policy Studies, and Rea S. Hederman, Jr., is a Senior Policy Analyst in the Center for Data Analysis, at The Heritage Foundation.
Methodological Appendix
This paper examines the distribution of income and income inequality with data extracted from the Current Population Survey for the year 2002, conducted in March 2003. Like the Census Bureau, this paper studies income at the household level. Group quarters are not included in this survey. The authors also used data extracted from the Heritage Income Tax Model, which contains a sample of actual tax returns designed to replicate the total tax returns received by the Internal Revenue Service. In general, this study does not account for the underreporting of income to the Census Bureau.
Post-Tax Income
Comprehensive post-tax income includes money income plus realized capital gains, the earned income credit, employer-provided health insurance, school lunch benefits, food stamp benefits, government rent subsidies, Medicaid, and Medicare benefits. Federal and state income taxes, payroll taxes, and property taxes are subtracted. Income variables that were given only at the family or person level were aggregated to the household level. Thus, all FICA taxes paid by a household were added together by person and then subtracted from the household’s final income. Food stamps and other family-level income data were treated in the same manner.Comprehensive post-tax income is very similar to the Census income “definition 14″ as detailed in the Census Bureau’s Current Population Reports, Income, poverty and Valuation on Noncash Benefits, except that it employs the basic market or insurance value for Medicaid and Medicare without the “fungible” adjustment.13 The insurance value of Medicaid and Medicare (also called the market value) equals the average net government outlay for persons of a specific risk class within a given state. The risk classes used are elderly, disabled persons, non-disabled adult, and non-disabled child. Under this approach, the value of Medicaid or Medicare equals the average cost to the government of medical services provided to a given class of persons; it does not report specific medical expenditures for particular individuals.
The fungible method of valuing Medicare and Medicaid begins with the insurance value of benefits but then alters the values based on the family’s income class. The full insurance value is assigned to benefits received by the middle class, but a lower value or zero value is assigned when the same benefits are received by a low-income household. The fungible adjustment was devised for the measurement of poverty, not income distribution. In measuring poverty, it is used to determine whether a household’s income should be considered above the poverty threshold. However, the fungible adjustment, which deliberately reduces the value of benefits received by low-income groups, is not appropriate for the measure of income equality that seeks to compare the economic resources of one household relative to others. The fungible adjustment results in a substantial undercounting of government transfers to low income groups.
Top Coding
An adjustment was made to compensate for the Census’ top coding restriction. Top coding limits the maximum value of capital gains reported in the CPS to $99,999. With normal CPS data, capital gains values that exceed this limit are simply reported as $99,999. In order to obtain a more thorough estimate of high levels of capital gains income, we have replaced those capital gains values subject to the top coding restriction with higher values taken from Internal Revenue Service data. This adjustment was made in the following manner: The Heritage Tax Model was used to determine the mean amount of capital gains income for those returns that reported capital gains income above $99,999. The new mean amount of capital gains was substituted to replace each CPS top-coded value of capital gains. As a result, the amount of capital gains income in the study was increased substantially. These adjustments mainly increase reported incomes in the top quintile.Ranking
Adjustments to income in stages 2 and 3 were performed at the level of individual households. After each adjustment, the households were re-ranked based on their new income figures. Households then were weighted according to the CPS household weight variable. The stage 4 adjustments are more general; earnings were adjusted at the quintile level based the aggregate earnings and average labor data within the quintile.READ OUR LATEST REPORT ON Taxes Research Review: Spending Cuts Are Better Than Tax Increases
Read More
Read More
The top fifth of U.S. households perform a third of all labor,
contain the best educated and most productive workers, provide a
disproportionate share of the investment needed to create jobs and
spur economic growth, and pay 82.5 percent of federal income taxes
and two-thirds of federal taxes overall. Raising their taxes even
higher would reduce economic growth, harming all Americans.
Leadership for America Campaign
About the Author
 Rea S. Hederman, Jr. Director, Center for Data Analysis and Lazof Family FellowRead More >>
Request an interview >>

Other Reports By This Author


About The Heritage Foundation
The Heritage Foundation is the nation’s most broadly supported public policy research institute, with hundreds of thousands of individual, foundation and corporate donors. Heritage, founded in February 1973, a staff of 275 and an annual expense budget of $82.4 million.Our mission is to formulate and promote conservative public policies based on the principles of free enterprise, limited government, individual freedom, traditional American values, and a strong national defense. Read More
1– 25 of 3205 Most Relevant Results
Heritage Recommends:
- The Economy Hits Home The Economy Hits Home booklet series breaks down key economic issues facing our nation today and explores how they affect family and society.
- Marriage: What Social Science Says and Doesn’t Say Social science data indicate that the intact family best ensures the current and future welfare of children and society when compared with other common forms of households.
- FamilyFacts.org FamilyFacts.org provides data on the family and religious practice and analysis of their role in maintaining civil society in America.
- Marriage and Caste in America: Separate and Unequal Families in a Post-Marital Age Our great family experiment threatens to turn what the Founders imagined as an opportunity-rich republic of equal citizens into a hereditary caste society.
- Welfare Issue Page All the latest Heritage Foundation research, videos, and blog posts about Welfare
- Topic Poverty and InequalityThe typical poor person in the United States has a far higher living standard than the public imagines. While their lives are not opulent, they Experts: Katherine Bradley, Robert Rector, Rachel Sheffield
Highlights: Marriage Reduces Child Poverty, What is U.S. Poverty Today?, 2010 Index of Dependence on Government, Understanding U.S. Poverty: Surprising Facts - Topic Understanding Poverty: Living Conditions of the Poor Combatting poverty in America begins with correctly diagnosing it. Poor persons in the United States have far higher living standards than the public imagines. Rather Experts: Katherine Bradley, Robert Rector, Rachel Sheffield
Highlights: What is Poverty in America?, Hunger Hysteria, Obamas New Poverty Measurement - Topic Reducing Poverty by Promoting Healthy MarriageChild poverty is an ongoing national concern, but few are aware that its principal cause is the absence of married fathers in the home. Marriage Experts: Christine Kim, Jennifer A. Marshall, Robert Rector, Rachel Sheffield
Highlights: Marriage Reduces Child Poverty, Marriage and Poverty in the U.S., Visit the New FamilyFacts.org - Commentary posted October 25, 2012 by Jennifer A. MarshallRyan on PovertyPaul Ryan has earned a reputation for making Americans confront fiscal deficits many would prefer to ignore. Yesterday in Cleveland, the chairman of the House …
- Blog Post on Sunday, November 18, 2012 More Misleading Numbers on PovertyThis past week, media outlets have been abuzz, heralding the news that poverty levels in the United States are higher than previously thought. But the …
- Commentary posted November 27, 2012 by Robert Rector‘Poverty’ Like We’ve Never Seen ItThe federal government now considers a family of four in New York City to be poor if its pre-tax income is below $37,900.Even with full …
- Blog Post on Wednesday, February 06, 2013 National Marriage Week: An Antidote to Child PovertyToday is the start of National Marriage Week, a weeklong campaign to “strengthen marriage, reduce divorce, and promote marriage prior to childbearing.” Although marriage benefits society …
- Blog Post on Thursday, November 01, 2012 How to Cure Poverty in America (VIDEO)Just last month, the U.S. Census Bureau revealed that the poverty rate has not changed significantly since the previous year: 46.2 million, or roughly 15 …
- Blog Post on Thursday, February 21, 2013 Family Fact of the Week: To Fight Poverty, Strengthen Marriage (VIDEO)“Marriage is the unsung antipoverty program,” says Sheila Weber, Executive Director of National Marriage Week. In the video above, citing Heritage Foundation research, Weber explains the …
- Blog Post on Wednesday, June 27, 2012 India Chooses PovertyWhen Indian officials are pressed about their failed policies, they typically talk about their nation’s fundamentals still being sound. Most observers (even most critics) accept …
- Blog Post on Wednesday, September 05, 2012 Marriage: The Greatest Weapon Against Child PovertyThe collapse of marriage, along with a dramatic rise in births to single women, is the most important cause of childhood poverty—but government policy doesn’t …
- Blog Post on Saturday, November 24, 2012 Why Is The Latino Poverty Rate So High?Read this post in Spanish at Libertad.org It has been reported recently that the poverty rate among Latinos has reached 28 percent. The number, based on a …
- Commentary posted February 7, 2012 by Robert RectorThe Facts About Poverty in AmericaMitt Romney declared last week that, if elected president, he would focus on restoring the fortunes of the middle class, not the poor. In a …
- Blog Post on Wednesday, September 12, 2012 What’s Driving High Poverty Numbers?
- [/caption]Today, the U.S. Census Bureau released …
- Commentary posted August 8, 2011 by Jennifer A. MarshallPoverty and Stewardship“God is watching.” A liberal Christian group sent that warning in an ad addressed to Congress and President Barack Obama during the recent debt fight. …
- Blog Post on Wednesday, February 13, 2013 A Simple and Wrong Answer to Poverty: Increasing the Minimum Wage Photo credit: NewscomHundreds wait in line for section 8 housing vouchers in Bloomington, Indiana, in July. (Photo: Polaris)During last night’s State of the Union address, President Obama proposed fighting poverty by raising the minimum wage. It …
- Special Report posted September 5, 2012 by Robert RectorMarriage: America’s Greatest Weapon Against Child Poverty[1]Calculated from data in U.S. Bureau of the Census, American …
- Blog Post on Friday, October 26, 2012 A New Anti-Poverty Agenda: Better Future for At-Risk YouthsA key component to effectively address poverty is recognizing and reducing barriers to the work of neighborhood organizations that are the lifeblood of our nation’s …
- Blog Post on Wednesday, August 15, 2012 Fareed Zakaria’s Poverty of IdeasGlobe-trotting journalist Fareed Zakaria is on suspension from his posts at CNN and TIME magazine after he admitted to plagiarizing sections of a column on …
- Audio on Tuesday, September 13, 2011 Istook856 What is Poverty?From The Heritage Foundation, I’m Ernest Istook. …
- Blog Post on Tuesday, July 03, 2012 Guest Post: Empowering Communities To Fight Poverty and ViolenceIt’s been nearly 50 years since Lyndon B. Johnson launched his War on Poverty, and much has been debated about the appropriate role of government …
- Blog Post on Friday, September 07, 2012 Family Fact of the Week: Marriage Is the Greatest Weapon Against Child PovertyNew research shows that marriage is the nation’s best antidote to child poverty. This holds true in every state across the country. On Wednesday, The Heritage …
- Commentary posted November 11, 2011 by Robert Rector, Rachel SheffieldWorse Than Useless Measure of PovertyOn Monday, the Census Bureau released a new poverty measure created by the Obama administration. Using this new calculation, Census officials assert that more than …
- Play Movie
![Robert Rector on Poverty on FBN]() Video on Tuesday, September 13, 2011 Robert Rector on Poverty on FBNRobert Rector discusses poverty in America. …
Video on Tuesday, September 13, 2011 Robert Rector on Poverty on FBNRobert Rector discusses poverty in America. …

© 2013, The Heritage Foundation
Conservative policy research since 1973
![content top]()

![content top]()

 Time Magazine, Vol. 152 No. 19
There’s so much suffering in the world. It can all get pretty overwhelming sometimes. Consider, for a moment the sorrow in the eyes of a CEO who’s just found out that his end-of-year bonus is only going to be a paltry $2.3 million.
“It felt like a slap in the face. Imagine what it would feel like just before Christmas to find out that you’re going to be forced to scrape by on your standard $8.4 million compensation package alone. Imagine what is was like to have to look into my daughter’s face and tell her that I couldn’t afford to both buy her a dollar sign shaped island and hire someone to chew her food from now on, too. To put her in that situation of having to choose… She’s only a child for God’s sake.”
It doesn’t have to be this way. Thanks to federal subsidies from taxpayers like you, CEO’s like G. Allen Andreas of Archer Daniels Midland was able to take home almost $14 million in executive compensation last year. But he’s one of the lucky ones. There are still corporations out there that actually have to provide goods and services to their consumers in order to survive. They need your help.
Note: I do not consider Medicaid to be included in the term “welfare” as it is used in common parlance. Typically, if one states that someone is “on welfare”, they mean that the person is receiving direct financial aid from the government. If we included Medicaid in our definition of social welfare, we would also have to consider any service that the government pays for to be “welfare”. For instance, public roadways to individuals’ homes would also be considered “welfare” under that expansive definition.
")
Graph Source: http://census.gov/hhes/www/poverty.html
The Cato Institute estimated that, in 2002, $93 billion were devoted to corporate welfare. This is about 5 percent of the federal budget.To clarify what is and isn’t corporate welfare, a “no-bid” Iraq contract for the prestigious Halliburton, would not be considered corporate welfare because the government technically directly receives some good or service in exchange for this expenditure. Based on the Pentagon’s Defense Contract Audit Agency (DCAA) findings of $1.4 billion of overcharging and fraud, I suppose the primary service they provide could be considered to be repeatedly violating the American taxpayer.On the other hand, the $15 billion in subsidies contained in the Energy Policy Act of 2005, to the oil, gas, and coal industries, would be considered corporate welfare because no goods or services are directly returned to the government in exchange for these expenditures.

Whenever corporate welfare is presented to voters, it always sounds like a pretty reasonable, well-intended idea. Politicians say that they’re stimulating the economy or helping struggling industries or creating jobs or funding important research. But when you steal money from the paychecks of working people, you hurt the economy by reducing their ability to buy the things they want or need. This decrease in demand damages other industries and puts people out of work.
Most of the pigs at the government trough are among the biggest companies in America, including the Big 3 automakers, Boeing, Archer Daniels Midland, and now-bankrupt Enron.

Graph Source: http://ers.usda.gov/data
Should we spend less on corporate welfare and/or social welfare programs? Or should we spend even more? It’s up to you. A bunch of people died horrible deaths to make sure this country remained a democracy, so if you feel strongly about this issue you owe it to them to call or write your congressman and senators and give them a piece of your mind.
Source: Office of Management and Budget, Budget of the United States Government (Washington: Government Publishing Office), various years; and data from the American Association for the Advancement of Science R&D Budget and Policy Program, various years.
Source: U.S. Department of Agriculture, Economic Research Service, http://www.ers.usda.gov/data.
Source: Export-Import Bank, 2006 Annual Report (Washington: Export-Import Bank, 2007).
Source Data from Chris Edwards at Cato:
Corporate Welfare by Agency
Corporate Welfare by Agency 2
Corporate Welfare by Company
I am extremely appreciative of any corrections or additional info that I left out. Please include hyperlinked SOURCES. I want to update this post with more recent numbers and more expansive definitions of both corporate and social welfare. My ultimate solution to this problem is wiki-izing ThinkByNumbers.org so that good citizens such as yourselves can correct any unfortunate omissions. I hope to have that feature functional in the coming months.
![Creative Commons License]() Think By Numbers by Mike P. Sinn is licensed under a Creative Commons Attribution 3.0 Unported License.
Think By Numbers by Mike P. Sinn is licensed under a Creative Commons Attribution 3.0 Unported License. ![]()
Conservative policy research since 1973
Welfare Reform and the Race to the Bottom: Theory and Evidence
Jan K. Brueckner
Southern Economic Journal
, Vol. 66, No. 3. (Jan., 2000), pp. 505-525.
Stable URL:
Southern Economic Journal
is currently published by Southern Economic Association.
Your use of the JSTOR archive indicates your acceptance of JSTOR’s Terms and Conditions of Use, available at
. JSTOR’s Terms and Conditions of Use provides, in part, that unless you have obtained
prior permission, you may not download an entire issue of a journal or multiple copies of articles, and you may use content in
the JSTOR archive only for your personal, non-commercial use.
Please contact the publisher regarding any further use of this work. Publisher contact information may be obtained at
.
Each copy of any part of a JSTOR transmission must contain the same copyright notice that appears on the screen or printed
page of such transmission.
The JSTOR Archive is a trusted digital repository providing for long-term preservation and access to leading academic
journals and scholarly literature from around the world. The Archive is supported by libraries, scholarly societies, publishers,
and foundations. It is an initiative of JSTOR, a not-for-profit organization with a mission to help the scholarly community take
advantage of advances in technology. For more information regarding JSTOR, please contact support@jstor.org.
Tue Jul 17 12:52:27 2007

Welfare Statistics
Share This ![Facebook]()
![Twitter]()
![More...]()

| Statistic Verification |
| Source: US Department of Health and Human Services, U.S. Department of Commerce, CATO Institute |
| Date Verified: 10.15.2012 |
| Welfare is the organized public or private social services for the assistance of disadvantaged groups. Aid could include general Welfare payments, health care through Medicaid, food stamps, special payments for pregnant women and young mothers, and federal and state housing benefits. The Welfare system in the United States began in the 1930s, during the Great Depression. Opponents of Welfare argue that it affects work incentives. |
| Welfare Statistics | |
| Total number of Americans on welfare | 4,300,000 |
| Total number of Americans on food stamps | 46,700,000 |
| Total number of Americans on unemployment insurance | 5,600,000 |
| Percent of the US population on welfare | 4.1 % |
| Total government spending on welfare annually (not including food stamps or unemployment) | $131.9 billion |
| Welfare Demographics | |
| Percent of recipients who are white | 38.8 % |
| Percent of recipients who are black | 39.8 % |
| Percent of recipients who are Hispanic | 15.7 % |
| Percent of recipients who are Asian | 2.4 % |
| Percent of recipients who are Other | 3.3 % |
| Welfare Statistics | |
| Total amount of money you can make monthly and still receive Welfare | $1000 |
| Total Number of U.S. States where Welfare pays more than an $8 per hour job | 40 |
| Number of U.S. States where Welfare pays more than a $12 per hour job | 7 |
| Number of U.S. States where Welfare pays more than the average salary of a U.S. Teacher | 9 |
| Average Time on AFCD (Aid to Families with Dependent Children) | |
| Time on AFDC | Percent of Recipients |
| Less than 7 months | 19% |
| 7 to 12 months | 15.2% |
| 1 to 2 years | 19.3% |
| 2 to 5 years | 26.9% |
| Over 5 years | 19.6% |
| Top 10 Hourly Wage Equivalent Welfare States in U.S. | |
| State | Hourly Wage Equivalent |
| Hawaii | $17.50 |
| Alaska | $15.48 |
| Massachusetts | $14.66 |
| Connecticut | $14.23 |
| Washington, D.C. | $13.99 |
| New York | $13.13 |
| New Jersey | $12.55 |
| Rhode Island | $12.55 |
| California | $11.59 |
| Virginia | $11.11 |
Tags: statistics on welfare ? how many people are on welfare ? welfare demographics ? how much money can you make and still receive welfare?, how many states does welfare pay more than minimum wage?, what is the percent of recipients stay on welfare for how long?, what are the top 10 states that pay the highest amount in average welfare per month? information on welfare per state ? how many americans are on welfare american’s ? number of americans collecting unemployment ? |
Related Statistics: |


Percentage of , Number of , Stats on , country with the most , average of , states with the most , least amount of , highest number of , annual amount of , what is the ? , how many ? , total number of , statistics on , facts about , why is the , where is the rarest least ?
http://www.statisticbrain.com/welfare-statistics/
 The Blog “The federal government administers nearly 80 different overlapping federal means-tested welfare programs,” the Senate Budget Committee notes. However, the committee states, the figures used in the chart do not include those who are only benefiting from Social Security and/or Medicare. Food stamps and Medicaid make up a large–and growing–chunk of the more than 100 million recipients. “Among the major means tested welfare programs, since 2000 Medicaid has increased from 34 million people to 54 million in 2011 and the Supplemental Nutrition Assistance Program (SNAP, or food stamps) from 17 million to 45 million in 2011,” says the Senate Budget Committee. “Spending on food stamps alone is projected to reach $800 billion over the next decade.” The data come “from the U.S. Census’s Survey of Income and Program Participation shows that nearly 110,000 million individuals received a welfare benefit in 2011. (These figures do not include other means-tested benefits such as the Earned Income Tax Credit or the health insurance premium subsidies included in the President’s health care law. CBO estimates that the premium subsidies, scheduled to begin in 2014, will cover at least 25 million individuals by the end of the decade.)” This is not just Americans, however. “These figures include not only citizens, but non-citizens as well,” according to the committee. © Copyright 2013 The Weekly Standard LLC – A Weekly Conservative Magazine & Blog. All Rights Reserved. Privacy Policy |

Government Spends More on Corporate Welfare Subsidies than Social Welfare Programs
 Time Magazine, Vol. 152 No. 19
About $59 billion is spent on traditional social welfare programs. $92 billion is spent on corporate subsidies. So, the government spent 50% more on corporate welfare than it did on food stamps and housing assistance in 2006.
Before we look at the details, a heartfelt plea from the Save the CEO’s Charitable Trust:There’s so much suffering in the world. It can all get pretty overwhelming sometimes. Consider, for a moment the sorrow in the eyes of a CEO who’s just found out that his end-of-year bonus is only going to be a paltry $2.3 million.
“It felt like a slap in the face. Imagine what it would feel like just before Christmas to find out that you’re going to be forced to scrape by on your standard $8.4 million compensation package alone. Imagine what is was like to have to look into my daughter’s face and tell her that I couldn’t afford to both buy her a dollar sign shaped island and hire someone to chew her food from now on, too. To put her in that situation of having to choose… She’s only a child for God’s sake.”
It doesn’t have to be this way. Thanks to federal subsidies from taxpayers like you, CEO’s like G. Allen Andreas of Archer Daniels Midland was able to take home almost $14 million in executive compensation last year. But he’s one of the lucky ones. There are still corporations out there that actually have to provide goods and services to their consumers in order to survive. They need your help.
For just $93 billion a year the federal government is able to provide a better life for these CEO’s and their families. That’s less than the cost of 240 million cups of coffee a day. Won’t you help a needy corporation today?
The Traditional Welfare Queen
Definition: social welfare
n. Financial aid, such as a subsidy, provided by a government to specific individuals.When one thinks about government welfare, the first thing that comes to mind is the proverbial welfare queen sitting atop her majestic throne of government cheese issuing a royal decree to her clamoring throngs of illegitimate babies that they may shut the hell up while she tries to watch Judge Judy. However, many politically well-connected corporations are also parasitically draining their share of fiscal blood from your paycheck before you ever see it. It’s called corporate welfare. The intent here is to figure out which presents the greater burden to our federal budget, corporate or social welfare programs.
There are, of course, positive and negative aspects to this spending.The primary negative aspect is that you have to increase taxes to pay for it. Taxing individuals lowers their standard of living. It reduces people’s ability to afford necessities like medical care, education, and low mileage off-road vehicles.The common usage definition of social welfare includes welfare checks and food stamps. Welfare checks are supplied through a federal program called Temporary Aid for Needy Families. Combined federal and state TANF spending was about $26 billion in 2006. In 2009, the federal government will spend about $25 billion on rental aid for low-income households and about $8 billion on public housing projects. For some perspective, that’s about 3 percent of the total federal budget.Note: I do not consider Medicaid to be included in the term “welfare” as it is used in common parlance. Typically, if one states that someone is “on welfare”, they mean that the person is receiving direct financial aid from the government. If we included Medicaid in our definition of social welfare, we would also have to consider any service that the government pays for to be “welfare”. For instance, public roadways to individuals’ homes would also be considered “welfare” under that expansive definition.
TANF (Temporary Aid to Needy Families)
Another negative aspect relates to the fact that social welfare programs reduce the incentive for recipients to become productive members of society. However, in 1996, Congress passed a bill enacting limited welfare reform, replacing the Aid to Families with Dependent Children (AFDC) program with the new Temporary Aid to Needy Families (TANF) program. One key aspect of this reform required recipients to engage in job searches, on the job training, community service work, or other constructive behaviors as a condition for receiving aid. The bill was signed by a man named Bill Clinton, who is much better known for an act of fellatio which, of course, had far greater societal implications. Regardless, the success of this reform was pretty dramatic. Caseloads were cut nearly in half. Once individuals were required to work or undertake constructive activities as a condition of receiving aid they left welfare rapidly. Another surprising result was a drop in the child poverty rate. Employment of single mothers increased substantially and the child poverty rate fell sharply from 20.8 percent in 1995 to 16.3 percent in 2000.")
Graph Source: http://census.gov/hhes/www/poverty.html
The Corporate Welfare Queen
Now, let’s consider the other kind of welfare.Definition: corporate welfare
n. Financial aid, such as a subsidy, provided by a government to corporations or other businesses.The Cato Institute estimated that, in 2002, $93 billion were devoted to corporate welfare. This is about 5 percent of the federal budget.To clarify what is and isn’t corporate welfare, a “no-bid” Iraq contract for the prestigious Halliburton, would not be considered corporate welfare because the government technically directly receives some good or service in exchange for this expenditure. Based on the Pentagon’s Defense Contract Audit Agency (DCAA) findings of $1.4 billion of overcharging and fraud, I suppose the primary service they provide could be considered to be repeatedly violating the American taxpayer.On the other hand, the $15 billion in subsidies contained in the Energy Policy Act of 2005, to the oil, gas, and coal industries, would be considered corporate welfare because no goods or services are directly returned to the government in exchange for these expenditures.

Infographic Source: http://awesome.good.is/transparency/web/1012/subsidize-this/flat.html
Tax breaks targeted to benefit specific corporations could also be considered a form of welfare. Tax loopholes force other businesses and individual taxpayers without the same political clout to pick up the slack and sacrifice a greater share of their hard-earned money to decrease the financial burden on these corporations. However, to simplify matters, we’ve only included financial handouts to companies in our working definition of corporate welfare.Whenever corporate welfare is presented to voters, it always sounds like a pretty reasonable, well-intended idea. Politicians say that they’re stimulating the economy or helping struggling industries or creating jobs or funding important research. But when you steal money from the paychecks of working people, you hurt the economy by reducing their ability to buy the things they want or need. This decrease in demand damages other industries and puts people out of work.
Most of the pigs at the government trough are among the biggest companies in America, including the Big 3 automakers, Boeing, Archer Daniels Midland, and now-bankrupt Enron.
Farm Subsidies
However, the largest fraction of corporate welfare spending, about 40%, went through the Department of Agriculture, most of it in the form of farm subsidies. (Edwards, Corporate Welfare, 2003) Well, that sounds OK. Someone’s got to help struggling family farms stay afloat, right? But in reality, farm subsidies actually tilt the cotton field in favor of the largest industrial farming operations. When it comes to deciding how to dole out the money, the agricultural subsidy system utilizes a process that is essentially the opposite of that used in the social welfare system’s welfare system. In the corporate welfare system, the more money and assets you have, the more government assistance you get. Conversely, social welfare programs are set up so that the more money and assets you have, the less government assistance you get. The result is that the absolute largest 7% of corporate farming operations receive 45% of all subsidies. (Edwards, Downsizing the Federal Government, 2004) So instead of protecting family farms, these subsidies actually enhance the ability of large industrial operations to shut them out of the market.
Graph Source: http://ers.usda.gov/data
Wal-Mart. Always high subsidies. Always.
The same is true in all other industries, too. The government gives tons of favors to the largest corporations, increasing the significant advantage they already have over smaller competing businesses. If, in the court of public opinion, Wal-Mart has been tried and convicted for the murder of main street, mom-and-pop America, then the government could easily be found guilty as a willing accomplice. Wal-Mart receives hundreds of millions of dollars of subsidization by local governments throughout the country. These subsidies take the form of bribes by local politicians trying to convince Wal-Mart to come to their town with the dream of significant job creation. Of course, from that follows a larger tax base. For example, a distribution center in Macclenny, Florida received $9 million in government subsidies in the form of free land, government-funded recruitment and training of employees, targeted tax breaks, and housing subsidies for employees allowing them to be paid significantly lower wages. A study by Good Jobs First found that 244 Wal-Marts around the country had received over $1 billion in government favors.The Big Picture
So now let’s look at the big picture. The final totals are $59 billion, 3 percent of the total federal budget, for regular welfare and $92 billion, 5 percent of the total federal budget, for corporations. So, the government spends roughly 50% more on corporate welfare than it does on these particular public assistance programs.Should we spend less on corporate welfare and/or social welfare programs? Or should we spend even more? It’s up to you. A bunch of people died horrible deaths to make sure this country remained a democracy, so if you feel strongly about this issue you owe it to them to call or write your congressman and senators and give them a piece of your mind.
Some More Sources:
2013 Budget: http://www.whitehouse.gov/sites/default/files/omb/budget/fy2013/assets/budget.pdfSource: Office of Management and Budget, Budget of the United States Government (Washington: Government Publishing Office), various years; and data from the American Association for the Advancement of Science R&D Budget and Policy Program, various years.
Source: U.S. Department of Agriculture, Economic Research Service, http://www.ers.usda.gov/data.
Source: Export-Import Bank, 2006 Annual Report (Washington: Export-Import Bank, 2007).
Source Data from Chris Edwards at Cato:
Corporate Welfare by Agency
Corporate Welfare by Agency 2
Corporate Welfare by Company
I am extremely appreciative of any corrections or additional info that I left out. Please include hyperlinked SOURCES. I want to update this post with more recent numbers and more expansive definitions of both corporate and social welfare. My ultimate solution to this problem is wiki-izing ThinkByNumbers.org so that good citizens such as yourselves can correct any unfortunate omissions. I hope to have that feature functional in the coming months.
Advance the Empiricist Movement!
This entry was posted by Mike P. Sinn on March 6, 2011 at 9:03 pm, and is filed under Corporate Welfare, Government Spending, Welfare. Follow any responses to this post through RSS 2.0.You can leave a response or trackback from your own site.
Join the Empiricist Movement!
![Facebook]()
![Google]()
![Yahoo]()
![Wordpress.com]()
- Enter your email address to subscribe to this blog and receive notifications of new posts by email.
Subscribe via Email
2012 Drug War Spending
DrugSense Drug War Clock Current Time Federal Spent State Spent Total Spent All Drug Arrests Cannabis Arrests Imprisoned


Wednesday, March 13, 2013 | 8:20 p.m.
SiteWeb
Web Search by YAHOO!
Posted: 7:39 p.m. Wednesday, March 13, 2013
Fla. Lt. Gov. Carroll resigns; won’t be replaced till after legislative session
By John Kennedy
Palm Beach Post Capital Bureau
TALLAHASSEE —
Jennifer Carroll
Personal: Age 53. Married, three children, including Miami Dolphin Nolan Carroll II. U.S. Navy veteran. Legally immigrated to the United States from Trinidad as an 8-year-old.
Political: Republican. Lieutenant governor, 2010-present. State representative from Fleming Island, 2003-10. Florida Secretary of Veterans Affairs, 2000-2002. Ran twice unsuccessfully for Congress.
Successes: Florida’s first black lieutenant governor and first woman elected to post; was sole black Republican in Legislature when Rick Scott chose her as running mate. Addressed 2000 Republican National Convention urging a new direction for Republican Party, one “embracing values of people like Colin Powell and Harriet Tubman.”
Controversies: Resigned Tuesday as lieutenant governor for having represented a purported charity that is being accused of skimming money from internet cafes. Also has dealt with accusations that she earned an MBA from a university revealed as an online diploma mill; questions linger from criminal case against a former aide who accused her of having a possible lesbian affair with another aide.
The Investigation
Operation: “Reveal the Deal,” a multi-state probe involving state, federal and local law enforcement.
Begun: July 2009 in Seminole County.
Focus: Allied Veterans of The World, a purported charity, accused in a $300 million conspiracy to pocket profits from 49 internet cafes in northern and central Florida.
Action: Authorities have executed 54 search warrants and 57 arrest warrants in 23 Florida counties and five additional states. Charges expected to be formally filed next week.
356 items


356 items
Palm Beach Post Capital Bureau
TALLAHASSEE —
Gov. Rick Scott said Wednesday that Lt. Gov. Jennifer Carroll “did the right thing for the state and for her family,” by abruptly resigning amid a wide-ranging criminal probe into a purported charity operating internet cafes in Florida.
Carroll worked as a consultant for the company in 2009 and 2010, while she was serving in the state House of Representatives. Financial disclosure records reviewed by The Palm Beach Post show she reported earning less than $1,000 from Allied Veterans of the World.
“I appreciate the efforts she made on behalf of the great state of Florida,” Scott said. “She was tireless. She put a lot of effort into the military and getting jobs going, and I’m very grateful for her service.”
Scott read from a statement at a crowded news conference outside the Capitol, moments after state and federal law enforcement officials in Orlando laid out allegations contained in 57 arrest warrants issued in Florida and five other states: South Carolina, Georgia, Alabama, Nevada and Pennsylvania. Two others accused of racketeering in the case also were arrested Monday in Oklahoma.
Asked about Carroll’s role, Scott said, “I’m not going to talk about the investigation at all. But I have no knowledge that she broke the law.”
Scott also said he would not make a decision on Carroll’s successor until after the legislative session’s scheduled May 3 finish.
The Republican governor told reporters, “It’s very disappointing to have to bring this news to you.”
Florida Attorney General Pam Bondi said charges will be formally filed next week against Allied Veterans officials. Charges will include racketeering, conspiracy, money laundering and possession of slot machines.
“It’s callous and it’s despicable,” Bondi said, adding it, “insults every American who ever wore a military uniform.”
Law enforcement officials also would not discuss Carroll’s involvement. A Navy veteran who served in the Gulf War, Carroll appeared in a 2011 TV ad promoting Allied Veterans’ charitable work.
Allied Veterans of the World and Affiliates Inc., based in St. Augustine, operates internet cafes at 49 sites around the state, mostly in North and Central Florida.
In 2011, it claimed to have contributed more than $2.5 million to veterans and first responders. The Post reported, however, that documents submitted to the state Department of Agriculture and Consumer Services, which regulates charities, provided no detail of the donations.
Investigators said Wednesday they could vouch for more than $6 million of charitable contributions by Allied Veterans from 2007 to early 2012. But that amount represented only about 2 percent of the more than $290 million made from gambling during that time period.
Most of the money went to for-profit companies and Allied Veterans’ executives, law enforcement officials said.
Authorities said they had seized about 300 bank accounts worth $64.7 million, along with high-end vehicles including Maseratis, Porsches and Ferraris.
Internet cafes – which have been dubbed the “casinos on the corner” – have flourished over the past decade, profiting even during years when Florida’s economy was punishing.
As many as 1,000 cafes are believed to operate in the state, part of what critics call a murky, billion-dollar industry that exploits gambling laws and preys on Floridians who can least afford to lose cash.
Those visiting the cafes purchase internet time – paying $15 and $25, more or less. They can browse the web – but most play sweepstakes games, in which computer credit or time is won. These winnings can be redeemed for payouts of as much as a few hundred dollars.
While law enforcement and local government officials have attempted to limit the number of cafes or gain more regulatory authority, industry leaders have pushed back, touting their lavish contributions to charities.
Internet cafes also have built a muscular lobbing force in Tallahassee, while contributing heavily to candidates.
Carroll, in 2010, introduced legislation that would have benefited the industry, but withdrew it after being questioned by reporters, later saying it was filed by a staffer without her approval.
Carroll submitted her two-sentence resignation letter late Tuesday, hours after she had been questioned by the Florida Department of Law Enforcement and then met with Scott chief-of-staff Adam Hollingsworth.
Scott staff said they believed the governor had not spoken with Carroll since Sunday.
In an emailed statement, Carroll said Wednesday she resigned because she didn’t want “allegations facing a former client of my public relations firm to undermine” the work of the administration. She also said, “Although I have made a decision to leave public office, I will not withdraw from public life.”
Carroll was already widely considered doubtful to remain as Scott’s running mate for his re-election campaign next year. But the governor was unwilling to address that Wednesday.
“It doesn’t matter…now about that,” Scott said.
Scott faces no legal time limit on appointing Carroll’s successor. State law says only that if there is no lieutenant governor and the governor’s post becomes vacant, the state’s attorney general — now Bondi — would become governor.
“Lots of people are interested in the job,” Scott said Wednesday. “But we’re not going to focus on that until after the end of the session.”
Former Gov. Jeb Bush’s lieutenant governor, Frank Brogan, resigned only months into the administration’s second term in 2003 – to take the job of president of Florida Atlantic University.
Bush named former two-time Senate President Toni Jennings as lieutenant governor, a post she held until both left office in 2006.
Jennings’ name came up again Wednesday in hall talk around the Capitol, possibly as a short-term successor to Carroll. Also mentioned was Sen. Anitere Flores, a Miami Republican, who was among those Scott considered before he chose Carroll in 2010.
But even Scott seemed not to be thinking much about a replacement – and whether his selection would be his running mate for next year.
Sen. John Thrasher, R-St. Augustine, a former Florida Republican Party chairman, said Scott can use the choice to help retool his administration, and sharpen his upcoming campaign.
“The governor now has to pick, frankly, somebody that he believes can help him in the campaign,” Thrasher said. “So I think it will be a benefit to him…down the road.”
Carroll, Florida’s first black lieutenant governor and the first woman elected to that position, was seen as a smart choice as Scott’s running mate.
Her legislative experience was a plus for Scott, a first-time candidate. But her career began unraveling only months after she took office.
A former aide, Carletha Cole, was accused of violating state law by recording a conversation without first notifying the other party, a recording she later shared with a newspaper reporter.
She defended herself, though, by claiming she was targeted for prosecution after having seen Carroll and a female travel aide in a “compromising position” inside the lieutenant governor’s office. Cole also said that Carroll’s chief-of-staff, John Konkus, had regularly recorded office conversations on orders from Scott’s staff and her own taping of her exchange with him last summer was designed to show how disjointed relations had become between the two offices.
The criminal case against Cole is still pending.
Even with Carroll removed, Florida Democratic Party Chair Allison Tant was quick to use the Carroll case against Scott.
“Floridians expected an administration focused on solving the problems facing Florida’s families, but instead got a scandal plagued governor and a revolving staff door,” Tant said. “Rick Scott and his administration have made a mockery of the governor’s office — embarrassing Floridians while failing to accomplish his legislative priorities.
“Scott campaigned on changing Tallahassee but his first three years have been more of the same corruption and waste that taxpayers have come to expect from Florida Republicans,” Tant concluded.
Staff writer Dara Kam contributed to this story.Carroll worked as a consultant for the company in 2009 and 2010, while she was serving in the state House of Representatives. Financial disclosure records reviewed by The Palm Beach Post show she reported earning less than $1,000 from Allied Veterans of the World.
“I appreciate the efforts she made on behalf of the great state of Florida,” Scott said. “She was tireless. She put a lot of effort into the military and getting jobs going, and I’m very grateful for her service.”
Scott read from a statement at a crowded news conference outside the Capitol, moments after state and federal law enforcement officials in Orlando laid out allegations contained in 57 arrest warrants issued in Florida and five other states: South Carolina, Georgia, Alabama, Nevada and Pennsylvania. Two others accused of racketeering in the case also were arrested Monday in Oklahoma.
Asked about Carroll’s role, Scott said, “I’m not going to talk about the investigation at all. But I have no knowledge that she broke the law.”
Scott also said he would not make a decision on Carroll’s successor until after the legislative session’s scheduled May 3 finish.
The Republican governor told reporters, “It’s very disappointing to have to bring this news to you.”
Florida Attorney General Pam Bondi said charges will be formally filed next week against Allied Veterans officials. Charges will include racketeering, conspiracy, money laundering and possession of slot machines.
“It’s callous and it’s despicable,” Bondi said, adding it, “insults every American who ever wore a military uniform.”
Law enforcement officials also would not discuss Carroll’s involvement. A Navy veteran who served in the Gulf War, Carroll appeared in a 2011 TV ad promoting Allied Veterans’ charitable work.
Allied Veterans of the World and Affiliates Inc., based in St. Augustine, operates internet cafes at 49 sites around the state, mostly in North and Central Florida.
In 2011, it claimed to have contributed more than $2.5 million to veterans and first responders. The Post reported, however, that documents submitted to the state Department of Agriculture and Consumer Services, which regulates charities, provided no detail of the donations.
Investigators said Wednesday they could vouch for more than $6 million of charitable contributions by Allied Veterans from 2007 to early 2012. But that amount represented only about 2 percent of the more than $290 million made from gambling during that time period.
Most of the money went to for-profit companies and Allied Veterans’ executives, law enforcement officials said.
Authorities said they had seized about 300 bank accounts worth $64.7 million, along with high-end vehicles including Maseratis, Porsches and Ferraris.
Internet cafes – which have been dubbed the “casinos on the corner” – have flourished over the past decade, profiting even during years when Florida’s economy was punishing.
As many as 1,000 cafes are believed to operate in the state, part of what critics call a murky, billion-dollar industry that exploits gambling laws and preys on Floridians who can least afford to lose cash.
Those visiting the cafes purchase internet time – paying $15 and $25, more or less. They can browse the web – but most play sweepstakes games, in which computer credit or time is won. These winnings can be redeemed for payouts of as much as a few hundred dollars.
While law enforcement and local government officials have attempted to limit the number of cafes or gain more regulatory authority, industry leaders have pushed back, touting their lavish contributions to charities.
Internet cafes also have built a muscular lobbing force in Tallahassee, while contributing heavily to candidates.
Carroll, in 2010, introduced legislation that would have benefited the industry, but withdrew it after being questioned by reporters, later saying it was filed by a staffer without her approval.
Carroll submitted her two-sentence resignation letter late Tuesday, hours after she had been questioned by the Florida Department of Law Enforcement and then met with Scott chief-of-staff Adam Hollingsworth.
Scott staff said they believed the governor had not spoken with Carroll since Sunday.
In an emailed statement, Carroll said Wednesday she resigned because she didn’t want “allegations facing a former client of my public relations firm to undermine” the work of the administration. She also said, “Although I have made a decision to leave public office, I will not withdraw from public life.”
Carroll was already widely considered doubtful to remain as Scott’s running mate for his re-election campaign next year. But the governor was unwilling to address that Wednesday.
“It doesn’t matter…now about that,” Scott said.
Scott faces no legal time limit on appointing Carroll’s successor. State law says only that if there is no lieutenant governor and the governor’s post becomes vacant, the state’s attorney general — now Bondi — would become governor.
“Lots of people are interested in the job,” Scott said Wednesday. “But we’re not going to focus on that until after the end of the session.”
Former Gov. Jeb Bush’s lieutenant governor, Frank Brogan, resigned only months into the administration’s second term in 2003 – to take the job of president of Florida Atlantic University.
Bush named former two-time Senate President Toni Jennings as lieutenant governor, a post she held until both left office in 2006.
Jennings’ name came up again Wednesday in hall talk around the Capitol, possibly as a short-term successor to Carroll. Also mentioned was Sen. Anitere Flores, a Miami Republican, who was among those Scott considered before he chose Carroll in 2010.
But even Scott seemed not to be thinking much about a replacement – and whether his selection would be his running mate for next year.
Sen. John Thrasher, R-St. Augustine, a former Florida Republican Party chairman, said Scott can use the choice to help retool his administration, and sharpen his upcoming campaign.
“The governor now has to pick, frankly, somebody that he believes can help him in the campaign,” Thrasher said. “So I think it will be a benefit to him…down the road.”
Carroll, Florida’s first black lieutenant governor and the first woman elected to that position, was seen as a smart choice as Scott’s running mate.
Her legislative experience was a plus for Scott, a first-time candidate. But her career began unraveling only months after she took office.
A former aide, Carletha Cole, was accused of violating state law by recording a conversation without first notifying the other party, a recording she later shared with a newspaper reporter.
She defended herself, though, by claiming she was targeted for prosecution after having seen Carroll and a female travel aide in a “compromising position” inside the lieutenant governor’s office. Cole also said that Carroll’s chief-of-staff, John Konkus, had regularly recorded office conversations on orders from Scott’s staff and her own taping of her exchange with him last summer was designed to show how disjointed relations had become between the two offices.
The criminal case against Cole is still pending.
Even with Carroll removed, Florida Democratic Party Chair Allison Tant was quick to use the Carroll case against Scott.
“Floridians expected an administration focused on solving the problems facing Florida’s families, but instead got a scandal plagued governor and a revolving staff door,” Tant said. “Rick Scott and his administration have made a mockery of the governor’s office — embarrassing Floridians while failing to accomplish his legislative priorities.
“Scott campaigned on changing Tallahassee but his first three years have been more of the same corruption and waste that taxpayers have come to expect from Florida Republicans,” Tant concluded.
Jennifer Carroll
Personal: Age 53. Married, three children, including Miami Dolphin Nolan Carroll II. U.S. Navy veteran. Legally immigrated to the United States from Trinidad as an 8-year-old.
Political: Republican. Lieutenant governor, 2010-present. State representative from Fleming Island, 2003-10. Florida Secretary of Veterans Affairs, 2000-2002. Ran twice unsuccessfully for Congress.
Successes: Florida’s first black lieutenant governor and first woman elected to post; was sole black Republican in Legislature when Rick Scott chose her as running mate. Addressed 2000 Republican National Convention urging a new direction for Republican Party, one “embracing values of people like Colin Powell and Harriet Tubman.”
Controversies: Resigned Tuesday as lieutenant governor for having represented a purported charity that is being accused of skimming money from internet cafes. Also has dealt with accusations that she earned an MBA from a university revealed as an online diploma mill; questions linger from criminal case against a former aide who accused her of having a possible lesbian affair with another aide.
The Investigation
Operation: “Reveal the Deal,” a multi-state probe involving state, federal and local law enforcement.
Begun: July 2009 in Seminole County.
Focus: Allied Veterans of The World, a purported charity, accused in a $300 million conspiracy to pocket profits from 49 internet cafes in northern and central Florida.
Action: Authorities have executed 54 search warrants and 57 arrest warrants in 23 Florida counties and five additional states. Charges expected to be formally filed next week.
Advertisements
- Problem Gambling?
PAProblemGambling.comProblem Gambling Problem Gambling? - Casino With Hotel
About.com/Casino With HotelSearch for Casino With Hotel. Find Expert Advice on About.com.
Search For “gambling casino”
SiteWeb
Web Search by YAHOO!

Christie signs NJ Internet gambling bill into law
Get ready for betting in your jammies, at work, from the kitchen table, or at the beach: New Jerseyans — and possibly many others — will soon be able to gamble over the Internet. New Jersey Gov. Chris Christie signed a bill Tuesday legalizing Internet gambling, hours after the state …- Updated: 7:07 p.m. Tuesday, Feb. 26, 2013
Wanna bet gambling gets even bigger in Florida? Legislators take up the issue
Get ready for a lot of talk about more gambling in Florida. But it might take awhile before you have more places to plunk down a bet. With a new leadership in Tallahassee, a stalled economy and Las Vegas companies eager to build casinos in the Sunshine State, legislators will …- Updated: 3:11 p.m. Tuesday, Jan. 11, 2011
Report: Indian casinos revenue up slightly in 2011
Indian casinos brushed off weak consumer spending in a sluggish U.S. economic recovery to post a modest increase in revenue in 2011, an industry study reported Wednesday. Not only did revenue rise 3 percent, to $27.4 billion, but Indian casinos are holding on to their share of total casino gambling …- Updated: 4:06 a.m. Wednesday, Feb. 27, 2013
South Florida turning into a gambling strip
It’s a glitzy megalopolis that attracts gamblers throughout the United States, if not the entire world, a place where there’s high- and low-stakes action aplenty, plus shopping, dining and entertainment opportunities galore.Sound like Las Vegas? Try South Florida in just a decade.While the state’s gambling industry may be locked in …- Updated: 8:52 a.m. Friday, Nov. 27, 2009
Land around Miami Dolphins stadium, Miami Beach hall eyed for casinos
The Miami Dolphins may want the land surrounding their football stadium to be considered for a casino license, and have dispatched a lobbyist to preserve that option should Florida lawmakers approve a landmark expansion of gambling. Also on Friday, the Miami Beach Convention Center emerged as a potential casino site. …- Updated: 12:04 p.m. Saturday, Oct. 22, 2011

Casino rivals face off in Fort Lauderdale
In a debate here Tuesday, state Sen. Ellyn Bogdanoff, who favors an expansion of casino gambling in Florida, put her cards on the table.”We’ve always had a legislature here in Florida that is anti-gaming, but in the last 10 years we’ve become fourth in the nation in gaming anyway,” said …- Updated: 9:25 p.m. Tuesday, Nov. 29, 2011
Schultz: Gambling supporters trying to game Floridians
‘ Despite the broad agreement that exists for such an approach, there’s still too many Republicans in Congress who have refused to listen to the voices of reason and compromise that are coming from outside of Washington.’PRESIDENT OBAMA on the debt committee’s failure to reach a dealPoker players look for …- Updated: 7:04 p.m. Friday, Nov. 25, 2011

Unhealthy habit – smoking – brings casinos healthy business
One casino boasts that it is endorsed by the American Lung Association. Its main competitor has so much smoke that patrons sometimes wear surgical masks.Guess which one is making the most money?Sometimes the amenity that swings players to choose one casino over another has nothing to do with gambling. It’s …- Updated: 6:41 p.m. Tuesday, Aug. 31, 2010

As trend wanes, Vegas casinos fold on poker rooms
The Tropicana hoped to step back into the big leagues when it opened its poker room in the heart of the Las Vegas Strip, touting it as the coolest in town. But that same morning, federal agents shut down the three biggest online poker sites on the Internet. Last September, …- Updated: 12:17 p.m. Thursday, Feb. 28, 2013
South Florida lawmakers push bill to expand casino gambling in Broward, Miami-Dade
The possibility of casino gambling outside of tribal lands in Florida has gained traction in the state legislature this year after decades of lawmakers being reluctant to take on the issue.Senate GOP leaders are backing a proposal that would allow three casino resorts to open in Broward and Miami-Dade counties, …- Updated: 9:23 p.m. Tuesday, Oct. 25, 2011
Las Vegas casino execs roll dice in Tally; pitch idea of 6 resorts in Florida
Multibillion-dollar hotel resorts with casino gambling, celebrity chefs and luxury shopping.It could all come to Florida — if the state wants to cash in on its image as a sun-soaked haven for tourists and authorize sprawling, Vegas-style casino resorts, gambling executives told lawmakers Thursday.Executives from Las Vegas Sands, which operates …- Updated: 9:41 a.m. Friday, March 12, 2010
Head off a casino invasion: What happens in Vegas should stay in Vegas
To Rep. Bill Galvano, R-Bradenton, the Legislature is debating whether gambling “is going in a different direction in the state of Florida.”But to Nick Iarossi, who addressed Rep. Galvano’s committee 11 days ago on behalf of the Las Vegas Sands Corp., the debate is over: “There is a recognition now …- Updated: 5:34 p.m. Sunday, March 21, 2010
Recent editorials published in Nebraska newspapers
The Grand Island Independent. March 3, 2013. Gambling decisions should remain in the hands of the voters The Legislature’s General Affairs Committee heard a proposed constitutional amendment last week that would dramatically change the authorization of gambling in Nebraska. Currently, any expansion of gambling in the state, such as allowing …- Updated: 1:07 p.m. Monday, March 4, 2013
Florida casino gambling bill ‘dead for this year,’ House Rules chair says
The push to bring resort casinos to South Florida fizzled Friday, with the House sponsor of the measure abandoning the multibillion-dollar proposal for this year.Facing a hostile House panel — where opponents of expanding gambling said they had 10 of 15 members on their side — Rep. Erik Fresen, R-Miami, …- Updated: 11:23 p.m. Friday, Feb. 3, 2012
Florida casinos bill a catch-all, addressing the lottery, dog tracks, jai-alai, and Internet cafes
It’s already tough enough to get conservative lawmakers behind the concept of three new casinos in Florida, no matter how swanky. But the resorts’ prospects may be even trickier now that a rewrite of the “destination resorts” bill overhauls all types of gambling in the state, from greyhound races to …- Updated: 7:04 p.m. Monday, Jan. 2, 2012
Florida casino bill hits opposition; Rules chair calls it ‘major expansion’ of gambling
The allure of the money and jobs that three casinos might bring to Florida is fading even before the plan receives its first committee vote.State Sen. Ellyn Bogdanoff’s “destination resorts” proposal faced fierce opposition Wednesday morning from at least one GOP leader after three hours of testimony during the Regulated …- Updated: 7:50 p.m. Wednesday, Dec. 7, 2011
Casino bill is the wrong bet
Backers of the bill to allow “destination resort” casinos claim that allowing more gambling in Florida would mean less gambling in Florida.No, it won’t. Common sense says it won’t. History definitely says it won’t. From the lottery, which voters approved in 1986, to slots at Miami-Dade and Broward parimutuels (“racinos”), …- Updated: 7:53 p.m. Friday, Nov. 18, 2011
Southern Baptists concerned over Gingrich’s casino-related backing
A top official with the Southern Baptist Convention said it’s troubling that a casino magnate’s $10 million is funding much of the effort to make Newt Gingrich president. Gingrich should distance himself from casino gambling, said Richard Land, president of the Nashville-based Ethics & Religious Liberty Commission, the public policy …- Updated: 9:35 p.m. Thursday, Jan. 26, 2012
New casino bill worse deal
First reports to the contrary, the revised “destination resort” casino bill from state Sen. Ellyn Bogdanoff, R-Fort Lauderdale, wouldn’t ban Internet cafes. So there goes what we potentially liked most about her new effort, one of the most controversial issues the Legislature will consider as it convenes this week. In …- Updated: 6:50 p.m. Friday, Jan. 6, 2012

Estimates on permitting S. Fla. casinos range from break even to $1.7 billion in new taxes
Disagreements about how much cash and how many jobs luxury casinos would bring to the Sunshine State dominated Wednesday’s first public airing of a “destination resorts” bill designed to transform South Florida into an international gambling mecca. Allowing up to three full-fledged casinos in Miami-Dade and Broward counties could ring …- Updated: 1:57 p.m. Thursday, Nov. 17, 2011
Results 1 – 20 of 356next >
© 2013 Cox Media Group. By using this website, you accept the terms of our Visitor Agreement and Privacy Policy, and understand your options regarding Ad Choices![AdChoices]() .
.
Edition: US
SiDevilIam

37 million poor hidden in the land of plenty
Americans have always believed that hard work will bring rewards, but vast numbers now cannot meet their bills even with two or three jobs. More than one in 10 citizens live below the poverty line, and the gap between the haves and have-nots is widening
- Paul Harris in Kentucky
- The Observer, Saturday 18 February 2006
The flickering television in Candy Lumpkins’s trailer blared out The Bold and the Beautiful. It was a fantasy daytime soap vision of American life with little relevance to the reality of this impoverished corner of Kentucky.The Lumpkins live at the definition of the back of beyond, in a hollow at the top of a valley at the end of a long and muddy dirt road. It is strewn with litter. Packs of stray dogs prowl around, barking at strangers. There is no telephone and since their pump broke two weeks ago Candy has collected water from nearby springs. Oblivious to it all, her five-year-old daughter Amy runs barefoot on a wooden porch frozen by a midwinter chill.It is a vision of deep and abiding poverty. Yet the Lumpkins are not alone in their plight. They are just the negative side of the American equation. America does have vast, wealthy suburbs, huge shopping malls and a busy middle class, but it also has vast numbers of poor, struggling to make it in a low-wage economy with minimal government help.A shocking 37 million Americans live in poverty. That is 12.7 per cent of the population – the highest percentage in the developed world. They are found from the hills of Kentucky to Detroit’s streets, from the Deep South of Louisiana to the heartland of Oklahoma. Each year since 2001 their number has grown.Under President George W Bush an extra 5.4 million have slipped below the poverty line. Yet they are not a story of the unemployed or the destitute. Most have jobs. Many have two. Amos Lumpkins has work and his children go to school. But the economy, stripped of worker benefits like healthcare, is having trouble providing good wages.Even families with two working parents are often one slice of bad luck – a medical bill or factory closure – away from disaster. The minimum wage of $5.15 (£2.95) an hour has not risen since 1997 and, adjusted for inflation, is at its lowest since 1956. The gap between the haves and the have-nots looms wider than ever. Faced with rising poverty rates, Bush’s trillion-dollar federal budget recently raised massive amounts of defence spending for the war in Iraq and slashed billions from welfare programmes. For a brief moment last year in New Orleans, Hurricane Katrina brought America’s poor into the spotlight. Poverty seemed on the government’s agenda. That spotlight has now been turned off. ‘I had hoped Katrina would have changed things more. It hasn’t,’ says Cynthia Duncan, a sociology professor at the University of New Hampshire.
Oklahoma is in America’s heartland. Tulsa looks like picture-book Middle America. Yet there is hunger here. When it comes to the most malnourished poor in America, Oklahoma is ahead of any other state. It should be impossible to go hungry here. But it is not. Just ask those gathered at a food handout last week. They are a cross section of society: black, white, young couples, pensioners and the middle-aged. A few are out of work or retired, everyone else has jobs.
They are people like Freda Lee, 33, who has two jobs, as a marketer and a cashier. She has come to the nondescript Loaves and Fishes building – flanked ironically by a Burger King and a McDonald’s – to collect food for herself and three sons. ‘America is meant to be free. What’s free?’ she laughs. ‘All we can do is pay off the basics.’
Or they are people like Tammy Reinbold, 37. She works part-time and her husband works full-time. They have two children yet rely on the food handouts. ‘The church is all we have to fall back on,’ she says. She is right. When government help is being cut and wages are insufficient, churches often fill the gap. The needy gather to receive food boxes. They listen to a preacher for half an hour on the literal truth of the Bible. Then he asks them if they want to be born again. Three women put up their hands.
But why are some Tulsans hungry?
Many believe it is the changing face of the US economy. Tulsa has been devastated by job losses. Big-name firms like WorldCom, Williams Energy and CitGo have closed or moved, costing the city about 24,000 jobs. Now Wal-Mart embodies the new American job market: low wages, few benefits.
Well-paid work only goes to the university-educated. Many others who just complete high school face a bleak future. In Texas more than a third of students entering public high schools now drop out. These people are entering the fragile world of the working poor, where each day is a mere step away from tragedy. Some of those tragedies in Tulsa end up in the care of Steve Whitaker, a pastor who runs a homeless mission in the shadow of a freeway overpass.
Each day the homeless and the drug addicted gather here, looking for a bed for the night. Some also want a fresh chance. They are men like Mark Schloss whose disaster was being left by his first wife. The former Wal-Mart manager entered a world of drug addiction and alcoholism until he wound up with Whitaker. Now he is back on track, sporting a silver ring that says Faith, Hope, Love. ‘Without this place I would be in prison or dead,’ he says. But Whitaker equates saving lives with saving souls. Those entering the mission’s rehabilitation programme are drilled in Bible studies and Christianity. At 6ft 5in and with a black belt in karate, Whitaker’s Christianity is muscular both literally and figuratively. ‘People need God in their lives,’ he says.
These are mean streets. Tulsa is a city divided like the country. Inside a building run by Whitaker’s staff in northern Tulsa a group of ‘latch-key kids’ are taking Bible classes after school while they wait for parents to pick them up. One of them is Taylor Finley, aged nine. Wearing a T-shirt with an American flag on the front, she dreams of travel. ‘I want to have fun in a new place, a new country,’ she says. Taylor wants to see the world outside Oklahoma. But at the moment she cannot even see her own neighbourhood. The centre in which she waits for mom was built without windows on its ground floor. It was the only way to keep out bullets from the gangs outside.
During the 2004 election the only politician to address poverty directly was John Edwards, whose campaign theme was ‘Two Americas’. He was derided by Republicans for doing down the country and – after John Kerry picked him as his Democratic running mate – the rhetoric softened in the heat of the campaign.
But, in fact, Edwards was right. While 45.8 million Americans lack any health insurance, the top 20 per cent of earners take over half the national income. At the same time the bottom 20 per cent took home just 3.4 per cent. Whitaker put the figures into simple English. ‘The poor have got poorer and the rich have got richer,’ he said.
Dealing with poverty is not a viable political issue in America. It jars with a cultural sense that the poor bring things upon themselves and that every American is born with the same chances in life. It also runs counter to the strong anti-government current in modern American politics. Yet the problem will not disappear. ‘There is a real sense of impending crisis, but political leaders have little motivation to address this growing divide,’ Cynthia Duncan says.
There is little doubt which side of America’s divide the hills of east Kentucky fall on. Driving through the wooded Appalachian valleys is a lesson in poverty. The mountains have never been rich. Times now are as tough as they have ever been. Trailer homes are the norm. Every so often a lofty mansion looms into view, a sign of prosperity linked to the coal mines or the logging firms that are the only industries in the region. Everyone else lives on the margins, grabbing work where they can. The biggest cash crop is illicitly grown marijuana.
Save The Children works here. Though the charity is usually associated with earthquakes in Pakistan or famine in Africa, it runs an extensive programme in east Kentucky. It includes a novel scheme enlisting teams of ‘foster grandparents’ to tackle the shocking child illiteracy rates and thus eventually hit poverty itself.
The problem is acute. At Jone’s Fork school, a team of indomitable grannies arrive each day to read with the children. The scheme has two benefits: it helps the children struggle out of poverty and pays the pensioners a small wage. ‘This has been a lifesaver for me and I feel as if the children would just fall through the cracks without us,’ says Erma Owens. It has offered dramatic help to some. One group of children are doing so well in the scheme that their teacher, Loretta Shepherd, has postponed retirement in order to stand by them. ‘It renewed me to have these kids,’ she said.
Certainly Renae Sturgill sees the changes in her children. She too lives in deep poverty. Though she attends college and her husband has a job, the Sturgill trailer sits amid a clutter of abandoned cars. Money is scarce. But now her kids are in the reading scheme and she has seen how they have changed. Especially eight-year-old Zach. He’s hard to control at times, but he has come to love school. ‘Zach likes reading now. I know it’s going to be real important for him,’ Renae says. Zach is shy and won’t speak much about his achievements. But Genny Waddell, who co-ordinates family welfare at Jone’s Fork, is immensely proud. ‘Now Zach reads because he wants to. He really fought to get where he is,’ she says.
In America, to be poor is a stigma. In a country which celebrates individuality and the goal of giving everyone an equal opportunity to make it big, those in poverty are often blamed for their own situation. Experience on the ground does little to bear that out. When people are working two jobs at a time and still failing to earn enough to feed their families, it seems impossible to call them lazy or selfish. There seems to be a failure in the system, not the poor themselves.
It is an impression backed up by many of those mired in poverty in Oklahoma and Kentucky. Few asked for handouts. Many asked for decent wages. ‘It is unfair. I am working all the time and so what have I done wrong?’ says Freda Lee. But the economy does not seem to be allowing people to make a decent living. It condemns the poor to stay put, fighting against seemingly impossible odds or to pull up sticks and try somewhere else.
In Tulsa, Tammy Reinbold and her family are moving to Texas as soon as they save the money for enough petrol. It could take several months. ‘I’ve been in Tulsa 12 years and I just gotta try somewhere else,’ she says.
Savethechildren.org
From Tom Joad to Roseanne
In a country that prides itself on a culture of rugged individualism, hard work and self-sufficiency, it is no surprise that poverty and the poor do not have a central place in America’s cultural psyche.
But in art, films and books American poverty has sometimes been portrayed with searing honesty. John Steinbeck’s novel The Grapes of Wrath, which was made into a John Ford movie, is the most famous example. It was an unflinching account of the travails of a poor Oklahoma family forced to flee the Dust Bowl during the 1930s Depression. Its portrait of Tom Joad and his family’s life on the road as they sought work was a nod to wider issues of social justice in America.
Another ground-breaking work of that time was James Agee’s Let Us Now Praise Famous Men, a non-fiction book about time spent among poor white farmers in the Deep South. It practically disappeared upon its first publication in 1940 but in the Sixties was hailed as a masterpiece. In mainstream American culture, poverty often lurks in the background. Or it is portrayed – as in Sergio Leone’s crime epic Once Upon A Time In America – as the basis for a tale of rags to riches.
One notable, yet often overlooked, exception was the great success of the sitcom Roseanne. The show depicted the realities of working-class Middle American life with a grit and humour that is a world away from the usual sitcom settings in a sunlit suburbia, most often in New York or California. The biggest sitcoms of the past decade – Friends, Frasier or Will and Grace – all deal with aspirational middle-class foibles that have little relevance to America’s millions of working poor.
An America divided
· There are 37 million Americans living below the poverty line. That figure has increased by five million since President George W. Bush came to power.
· The United States has 269 billionaires, the highest number in the world.
· Almost a quarter of all black Americans live below the poverty line; 22 per cent of Hispanics fall below it. But for whites the figure is just 8.6 per cent.
· There are 46 million Americans without health insurance.
· There are 82,000 homeless people in Los Angeles alone.
· In 2004 the poorest community in America was Pine Ridge Indian reservation. Unemployment is over 80 per cent, 69 per cent of people live in poverty and male life expectancy is 57 years. In the Western hemisphere only Haiti has a lower number.
· The richest town in America is Rancho Santa Fe in California. Average incomes are more than $100,000 a year; the average house price is $1.7m.
You searched for ‘poverty’
39,613 resultsPage 1 of 3962 Next >>
Page 1 of 3962 Next >>
More relevant articles matching your search…
- Comment is free
Editorial: Politicians must show us the money to end poverty
The Guardian, 18 Feb 2009
Editorial
Editorial: There are moments when even determined egalitarians wonder whether Jesus had it right when he suggested that the poor will be always with us
… of poor parents in the name of ending child poverty. An Institute for Fiscal Studies report today, however, casts doubt on whether his goal will ever be reached. Taken together, the budgets of the last decade have handed hard-up families thousands… - Comment is free
Leader: Better times
The Guardian, 14 Mar 2008
Leader
Leader: This week the government has shown that – even in hard times – tackling poverty remains a priority. Labour can take pride in that
… that youngsters growing up poor have their chances blighted – in terms of health, education and career. Grasping that this makes a mockery of equality of opportunity, Gordon Brown made ending child poverty his defining crusade. Progress, however, has been… - Comment is free
Leader: Time for tough choices
The Guardian, 4 Dec 2007
Leader
Leader: Like the Hydra, poverty is a monster with many heads – want, squalor and ignorance to name just a few
…Like the Hydra, poverty is a monster with many heads – want, squalor and ignorance to name just a few. Yesterday’s audit from the New Policy Institute (NPI) surveyed the lot, and found mixed progress in the battle against them. Figures… - Comment is free
Leader: Poverty
The Guardian, 28 Mar 2007
Leader
Leader: For supporters of the embattled Labour government, the progress made in tackling poverty has been the strongest reason to keep the faith.
…For supporters of the embattled Labour government, the progress made in tackling poverty has been the strongest reason to keep the faith. After the long Conservative era, in which the poor lagged further behind each year, the signs had been… - Politics
Leader: Bridging the divide
The Guardian, 12 Jan 2005
Leader
Leader: This year’s campaign to ‘make poverty history’ in developing states is long overdue, but a campaign tackling poverty at home is also urgently needed.
…This year’s campaign to “make poverty history” in developing states is long overdue, but a parallel campaign tackling poverty at home is also urgently needed. For all the progress made by Labour since it was elected – and it has been impressive… - Politics
Leader: poverty
The Guardian, 4 Feb 2004
Leader
At the start of its centenary year, the Joseph Rowntree Foundation (JRF) yesterday brought together thinktanks spanning the main political spectrum to explore how far a consensus could be built on tackling poverty.
… a consensus could be built on tackling poverty. Five thinktanks were asked to respond to a 20-year agenda that JRF drew up last year to tackle disadvantage. The two main parties fielded spokesmen as well. A conference of policy wonks was invited to stir… - Environment
Cows are better off than half the world
The Guardian, 22 Aug 2002
Charlotte Denny
The growing chasm between rich and poor is threatening global security, writes Charlotte Denny.
… development index, are roughly equivalent to those in the west 600 years ago. Average income per head stands at only $130 a year – less than the $1-a-day level that the World Bank regards as subsistence level. The impact of such extreme poverty… - Society
The gap the between rich and poor
The Observer, 8 Jul 2001
Alison Benjamin
Supermarkets and banks are being drafted into the fight for social justice in Britain’s poorest cities.
…A quarter of Britain’s population is living below the breadline, according to the most comprehensive study ever undertaken into poverty and social exclusion in Britain. What was most alarming about the poverty detailed in last year… - Society
Spiral of debt
The Guardian, 19 Apr 2000
Niall Cooper on people who have to pay huge interest on loans to keep the family afloat
…” is a coalition of over 20 agencies, including Church Action on Poverty, Help the Aged, New Economics Foundation, the Money Advice Association and Oxfam. They all share a common purpose: to stop the poorest from being consigned to a lifetime of high… - Society
Forgotten no longer
The Guardian, 29 Sep 1999
Ending social exclusion remains a key Labour goal. Gerard Lemos looks at the estate where Tony Blair after the election promised that regeneration would be a priority
- © 2013 Guardian News and Media Limited or its affiliated companies. All rights reserved.
U.S. Department of Commerce

Search
Poverty
Census.gov› People and Households› Poverty Main›
Poverty Main
The Census Bureau reports poverty data from several major household surveys and programs. The Annual Social and Economic Supplement (ASEC) to the Current Population Survey (CPS) is the source of official national poverty estimates. The American Community Survey (ACS) provides single and multi-year estimates for smaller areas. The Survey of Income and Program Participation (SIPP) provides longitudinal estimates. The Small Area Income and Poverty Estimates (SAIPE) program provides model-based poverty estimates for counties and school districts. See Description of Income and Poverty Data Sources to determine which survey or program meets your specific needs.Latest Releases
Income, Poverty, and Health Insurance Coverage in the United States: 2011 (P60-243)Poverty Rates for Selected Detailed Race and Hispanic Groups by State and Place: 2007–2011 (ACSBR/11-17)
Poverty and Shared Households by State: 2011 (ACSBR/11-05)
Poverty: 2010 and 2011 American Community Survey (ACSBR/11-01)
Sharing a Household: Household Composition and Economic Well-Being: 2007-2010 (P60-242)
Areas With Concentrated Poverty: 2006-2010 (ACSBR/10-17) [PDF - 764k]
Child Poverty Brief 2009 and 2010: Rates by Race & Hispanic Origin by State (ACSBR/10-05) [PDF - 1.3M]
Poverty: 2009 and 2010 American Community Survey (ACSBR/10-01) [PDF - 737k]
Dynamics of Economic Well-Being: Poverty 2004-2006
Latest Research – Supplemental Poverty Measure
Tables of NAS-based Experimental Poverty Estimates: 2009
Effect of Benefits and Taxes on Income and Poverty: 2009 (R&D)
Model-based Small Area Income & Poverty Estimates (SAIPE) for School Districts, Counties, and States for 2009
Poverty: 2008 and 2009 American Community Survey (ACSBR/09-01) [PDF - 234k]
Supplemental Poverty Measure — Federal Register Notice
Observations from the Interagency Technical Working Group on Developing a Supplemental Poverty Measure [PDF - 138k]
Related Sites
Contact Us
For assistance, please contact the Census Call Center at 1-800-923-8282 (toll free) or visit ask.census.gov for further information.[PDF] or ![PDF]() denotes a file in Adobe’s Portable Document Format. To view the file, you will need the Adobe® Reader®
denotes a file in Adobe’s Portable Document Format. To view the file, you will need the Adobe® Reader®![Off Site]() available free from Adobe. This symbol
available free from Adobe. This symbol ![Off Site]() indicates a link to a non-government web site. Our linking to these sites does not constitute an endorsement of any products, services or the information found on them. Once you link to another site you are subject to the policies of the new site.
indicates a link to a non-government web site. Our linking to these sites does not constitute an endorsement of any products, services or the information found on them. Once you link to another site you are subject to the policies of the new site.
 denotes a file in Adobe’s Portable Document Format. To view the file, you will need the Adobe® Reader®
 available free from Adobe. This symbol indicates a link to a non-government web site. Our linking to these sites does not constitute an endorsement of any products, services or the information found on them. Once you link to another site you are subject to the policies of the new site.
Source: U.S. Census Bureau | Social, Economic, and Housing Statistics Division: Poverty | Last Revised: February 20, 2013
Sheldon Danziger
After Welfare Reform and an Economic Boom:
Why is
Child Poverty Still So Much Higher in the U.S.
than in
Europe?
PSC Research Report
Report No. 02-506
June 2002
P
OPULATION
S
TUDIES
C
ENTER
AT
THE
I
NSTITUTE
FOR
S
OCIAL
R
ESEARCH
U
NIVERSITY
OF
M
ICHIGAN
PSC
PSC Publications Population Studies Center, University of Michigan
PO Box 1248, Ann Arbor, MI 48106-1248 USA
The Population Studies Center
(PSC) at the University of Michigan is one of the oldest
population centers in the United States. Established in 1961 with a grant from the Ford
Foundation, the Center has a rich history as the main workplace for an interdisciplinary
community of scholars in the field of population studies. Today the Center is supported by a
Population Research Center Core Grant from the National Institute of Child Health and
Human Development (NICHD) as well as by the University of Michigan, the National Institute
on Aging, the Hewlett Foundation, and the Mellon Foundation.
PSC Research Reports
are prepublication working papers that report on current
demographic research conducted by PSC associates and affiliates. These papers are written for
timely dissemination and are often later submitted for publication in scholarly journals. The
PSC Research Report Series was begun in 1981. Copyrights for all Reports are held by the
authors. Readers may quote from, copy, and distribute this work as long as the copyright holder
and PSC are properly acknowledged and the original work is not altered.
Poverty in the United States
From Wikipedia, the free encyclopedia

In 2011, Extreme poverty in the United States, meaning households living on less than $2 per day before government benefits, doubled from 1996 levels, to 1.5 million households, including 2.8 million children.[3] In 2013, child poverty reached record high levels, with 16.7 million children living in food insecure households, about 35% more than 2007 levels.[4] The number of people in the U.S. who are in poverty is approaching 1960s levels that led to the national War on Poverty.[5]
Poverty is a state of privation, or a lack of the usual or socially acceptable amount of money or material possessions.[6] The most common measure of poverty in the U.S. is the “poverty threshold” set by the U.S. government. This measure recognizes poverty as a lack of those goods and services commonly taken for granted by members of mainstream society.[7] The official threshold is adjusted for inflation using the consumer price index. The government’s definition of poverty is based on total income received. For example, the poverty level for 2012 was set at $23,050 (total yearly income) for a family of four.[8] Most Americans (58.5%) will spend at least one year below the poverty line at some point between ages 25 and 75.[9] Poverty rates are persistently higher in rural and inner city parts of the country as compared to suburban areas.[10][11]
Contents |
Measures of poverty
Measures of poverty can be either absolute or relative.Two official measures of poverty

Since the 1960s, the United States Government has defined poverty in absolute terms. When the Johnson administration declared “war on poverty” in 1964, it chose an absolute measure. The “absolute poverty line” is the threshold below which families or individuals are considered to be lacking the resources to meet the basic needs for healthy living; having insufficient income to provide the food, shelter and clothing needed to preserve health.
The “Orshansky Poverty Thresholds” form the basis for the current measure of poverty in the U.S. Mollie Orshansky was an economist working for the Social Security Administration (SSA). Her work appeared at an opportune moment. Orshansky’s article was published later in the same year that Johnson declared war on poverty. Since her measure was absolute (i.e., did not depend on other events), it made it possible to objectively answer whether the U.S. government was “winning” this war. The newly formed United States Office of Economic Opportunity adopted the lower of the Orshansky poverty thresholds for statistical, planning, and budgetary purposes in May 1965.
The Bureau of the Budget (now the Office of Management and Budget) adopted Orshansky’s definition for statistical use in all Executive departments. The measure gave a range of income cutoffs, or thresholds, adjusted for factors such as family size, sex of the family head, number of children under 18 years old, and farm or non-farm residence. The economy food plan (the least costly of four nutritionally adequate food plans designed by the Department of Agriculture) was at the core of this definition of poverty.[14]
The Department of Agriculture found that families of three or more persons spent about one third of their after-tax income on food. For these families, poverty thresholds were set at three times the cost of the economy food plan. Different procedures were used for calculating poverty thresholds for two-person households and persons living alone. Annual updates of the SSA poverty thresholds were based on price changes in the economy food plan.
Two changes were made to the poverty definition in 1969. Thresholds for non-farm families were tied to annual changes in the Consumer Price Index (CPI) rather than changes in the cost of the economy food plan. Farm thresholds were raised from 70 to 85% of the non-farm levels.
In 1981, further changes were made to the poverty definition. Separate thresholds for “farm” and “female-householder” families were eliminated. The largest family size category became “nine persons or more.”[14]
Apart from these changes, the U.S. government’s approach to measuring poverty has remained static for the past forty years.
Recent poverty rate and guidelines
| Persons in Family Unit | 48 Contiguous States and D.C. | Alaska | Hawaii |
|---|---|---|---|
| 1 | $11,170 | $13,970 | $12,860 |
| 2 | $15,130 | $18,920 | $17,410 |
| 3 | $19,090 | $23,870 | $21,960 |
| 4 | $23,050 | $28,820 | $26,510 |
| 5 | $27,010 | $33,770 | $31,060 |
| 6 | $30,970 | $38,720 | $35,610 |
| 7 | $34,930 | $43,670 | $40,160 |
| 8 | $38,890 | $48,620 | $44,710 |
| Each additional person adds | $3,960 | $4,950 | $4,550 |
Numbers in other countries
The official number of poor in the United States in 2008 is about 39.1 million people, greater in number but not percentage than the officially poor in Indonesia, which has a far lower Human Development Index and the next largest population after the United States.[17][18] The poverty level in the United States, with 15% (46.2 million people in poverty, of a total of 308.5 million) is comparable to the one in France, where 14% of the population live with less than 880 euros per month.[19][20]Number of poor are hard to compare across countries. Absolute income may be used but does not reflect the actual number of poor, which depend on relative income and cost of living in each country. Among developed countries, each country then has its own definition and threshold of what it means to be poor, but this is not adjusted for cost of living and social benefits. For instance, despite the fact that France and US have about the same threshold in terms of dollars amount for poverty, cost of living benefits differ, with universal health care and highly subsidized post-secondary education existing in France. In general, it might be better to use the Human Poverty Index (HPI), Human Development Index (HDI) or other global measure to compare quality of living in different countries.
Relative measures of poverty
Another way of looking at poverty is in relative terms. “Relative poverty” can be defined as having significantly less access to income and wealth than other members of society. Therefore, the relative poverty rate is a measure of income inequality. When the standard of living among those in more financially advantageous positions rises while that of those considered poor stagnates, the relative poverty rate will reflect such growing income inequality and increase. Conversely, the poverty rate can decrease, with low income people coming to have less wealth and income if wealthier people’s wealth is reduced by a larger percentage than theirs. In 1959, a family at the poverty line had an income that was 42.64% of the median income.[citation needed] If the poverty line in 1999 was less than 42.64% of the median income, then relative poverty would have increased.In the European Union and for the OECD, “relative poverty” is defined as an income below 60% of the national median equalized disposable income after social transfers for a comparable household. In Germany, for example, the official relative poverty line for a single adult person in 2003 was 938 euros per month (11,256 euros/year, $12,382 PPP. West Germany 974 euros/month, 11,688 euros/year, $12,857 PPP). For a family of four with two children below 14 years the poverty line was 1969.8 euros per month ($2,167 PPP) or 23,640 euros ($26,004 PPP) per year. According to Eurostat the percentage of people in Germany living at risk of poverty (relative poverty) in 2004 was 16% (official national rate 13.5% in 2003). Additional definitions for poverty in Germany are “poverty” (50% median) and “strict poverty” (40% median, national rate 1.9% in 2003). Generally the percentage for “relative poverty” is much higher than the quota for “strict poverty”. The U.S concept is best comparable to “strict poverty”. By European standards the official (relative) poverty rate in the United States would be significantly higher than it is by the U.S. measure. A research paper from the OECD calculates the relative poverty rate for the United States at 16% for 50% median of disposable income and nearly 24% for 60% of median disposable income[21] (OECD average: 11% for 50% median, 16% for 60% median).
Some critics argue that relying on income disparity to determine who is impoverished can be misleading. The Bureau of Labor Statistics data suggests that consumer spending varies much less than income. In 2008, the “poorest” one fifth of Americans households spent on average $12,955 per person for goods and services (other than taxes), the second quintile spent $14,168, the third $16,255, the fourth $19,695, while the “richest” fifth spent $26,644. The disparity of expenditures is much less than the disparity of income.[22][neutrality is disputed]
The income distribution and relative poverty
Although the relative approach theoretically differs largely from the Orshansky definition, crucial variables of both poverty definitions are more similar than often thought. First, the so-called standardization of income in both approaches is very similar. To make incomes comparable among households of different sizes, equivalence scales are used to standardize household income to the level of a single person household. In Europe, the modified OECD equivalence scale is used, which takes the combined value of 1 for the head of household, 0.5 for each additional household member older than 14 years and 0.3 for children. When compared to the US Census poverty lines, which is based on a defined basket of goods, for the most prevalent household types both standardization methods show to be very similar.Furthermore, the poverty threshold in Western-European countries is not always higher than the Orshansky threshold for a single person family. The actual Orchinsky poverty line for single person households in the US ($9645 in 2004) is very comparable to the relative poverty line in many Western-European countries (Belgium 2004: €9315), while price levels are also similar.[citation needed] The reason why relative poverty measurement causes high poverty levels in the US, as demonstrated by Förster,[21] is caused by distributional effects rather than real differences in well-being among EU-countries and the USA.
The median household income is much higher in the US than in Europe due to the wealth of the middle classes in the US, from which the poverty line is derived. Although the paradigm of relative poverty is most valuable, this comparison of poverty lines show that the higher prevalence of relative poverty levels in the US are not an indicator of a more severe poverty problem but an indicator of larger inequalities between rich middle classes and the low-income households. It is therefore not correct to state that the US income distribution is characterized by a large proportion of households in poverty; it is characterized by relatively large income inequality but also high levels of prosperity of the middle classes.[neutrality is disputed] The 2007 poverty threshold for a three member family is 17,070.
Poverty and demographics
In addition to family status, race/ethnicity and age also correlate with high poverty rates in the United States. Although data regarding race and poverty are more extensively published and cross tabulated the family status correlation is by far the strongest.Poverty and family status
According to the US Census, in 2007 5.8% of all people in married families lived in poverty,[27] as did 26.6% of all persons in single parent households[27] and 19.1% of all persons living alone.[27] More than 75% of all poor households are headed by women (2012).[28]

By race/ethnicity and family status, based on data from 2007
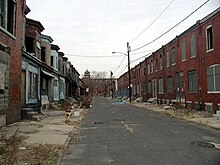
5.4% of all white persons (which includes white Hispanics),[29]
9.7% of all black persons (which includes black Hispanics),[30] and
14.9% of all Hispanic persons (of any race)[31] living in poverty.
Among single parent (male or female) families: 26.6% lived in poverty.[27] This number varied by race and ethnicity as follows”
22.5% of all white persons (which includes white Hispanics),[29]
44.0% of all black persons (which includes black Hispanics),[30] and
33.4% of all Hispanic persons (of any race)[31] living in poverty.
Among unrelated individuals living alone: 19.1% lived in poverty.[27] This number varied by race and ethnicity as follows:
18% of white persons (which includes white Hispanics)[32]
27.9% of black persons (which includes black Hispanics)[31] and
27% of Hispanic persons (of any race)[33] living in poverty
Poverty and race/ethnicity
The US Census declared that in 2010 15.1% of the general population lived in poverty:[34]9.9% of all non-Hispanic white persons
12.1% of all Asian persons
26.6% of all Hispanic persons (of any race)
27.4% of all black persons.
About half of those living in poverty are non-Hispanic white (19.6 million in 2010),[34] but poverty rates are much higher for blacks and Hispanics. Non-Hispanic white children comprised 57% of all poor rural children.[35]
In FY 2009, black families comprised 33.3% of TANF families, non-Hispanic white families comprised 31.2%, and 28.8% were Hispanic.[36]
Poverty and age
The US Census declared that in 2010 15.1% of the general population lived in poverty:22% of all people under age 18
13.7% of all people 19–64, and
9% of all people ages 65 and older[34]
The Organization for Economic Co-operation and Development (OECD) uses a different measure for poverty and declared in 2008 that child poverty in the US is 20% and poverty among the elderly is 23%.[37] The non-profit advocacy group Feeding America has released a study (May 2009) based on 2005–2007 data from the U.S. Census Bureau and the Agriculture Department, which claims that 3.5 million children under the age of 5 are at risk of hunger in the United States. The study claims that in 11 states, Louisiana, which has the highest rate, followed by North Carolina, Ohio, Kentucky, Texas, New Mexico, Kansas, South Carolina, Tennessee, Idaho and Arkansas, more than 20 percent of children under 5 are allegedly at risk of going hungry. (Receiving fewer than 1,800 calories per day) The study was paid by ConAgra Foods, a large food company.[38]
Child poverty
In 2013, child poverty reached record high levels in the U.S., with 16.7 million children living in food insecure households. 47 million Americans depend on food banks, more than 30% above 2007 levels. Households headed by single mothers are most likely to be affected. Worst effected are the District of Columbia, Oregon, Arizona, New Mexico and Florida, while North Dakota, New Hampshire, Virginia, Minnesota and Massachusetts are the least affected.[4]Poverty and education
Poverty affects individual access to quality education. The U.S. education system is funded by local communities; therefore the quality of materials and teachers is reflective of the affluence of community. Low income communities are not able to afford the quality education that high income communities are. Another important aspect of education in low income communities is the apathy of both students and teachers. To some the children of the poor or ignorant are seen as mere copies of their parents fated to live out the same poor or ignorant life. The effect of such a perception can be teachers that will not put forth the effort to teach and students that are opposed to learning; in both cases the idea is that the poor student is incapable. Due to these and other reasons the quality of education between the classes is not equal.[39]Food security
Eighty-nine percent of the American households were food secure throughout the entire year of 2002, meaning that they had access, at all times, to enough food for an active, healthy life for all of the household members. The remaining households were food insecure at least some time during that year. The prevalence of food insecurity rose from 10.7% in 2001 to 11.1% in 2002, and the prevalence of food insecurity with hunger rose from 3.3% to 3.5%.[40]In 2008, eighty-five percent of American households were food secure throughout the entire year.[41]
Factors in poverty
There are numerous factors related to poverty in the United States.- Income and intelligence have been found to be related. Charles Murray compared the earnings of 733 full sibling pairs with differing intelligence quotients (IQ’s). He referred to the sample as utopian in that the sampled pairs were raised in families with virtually no illegitimacy, divorce or poverty. The average earnings of sampled individuals with an IQ of under 75 was $11,000, compared to $16,000 for those with an IQ between 75 and 90, $23,000 for those with an IQ between 90 and 110, $27,000 for those with an IQ between 110 and 125, and $38,000 for those with an IQ above 125. [42]
- Income has a high correlation with educational levels. In 2007, the median earnings of household headed by individuals with less than a 9th grade education was $20,805 while households headed by high school graduates earned $40,456, households headed holders of bachelor’s degree earned $77,605, and families headed by individuals with professional degrees earned $100,000.[43]
- In many cases poverty is caused by job loss. In 2007, the poverty rate was 21.5% for individuals who were unemployed, but only 2.5% for individuals who were employed full-time.[43]
- In 1991, 8.3% of children in two-parent families were likely to live in poverty; 19.6% of children lived with father in single parent family; and 47.1% in single parent family headed by mother.[44]
- Income levels vary with age. For example, the median 2009 income for households headed by individuals age 15–24 was only $30,750, but increased to $50,188 for household headed by individuals age 25–34 and $61,083 for household headed by individuals 35–44.[45] Although the reasons are unclear, work experience and additional education may be factors.
- Income levels vary along racial/ethnic lines: 21% of all children in the United States live in poverty, about 46% of black children and 40% of Latino children live in poverty.[46] The poverty rate is 9.9% for black married couples and only 30% of black children are born to married couples (see Marriage below). Citing the Pew Researh Center,The Economist reports that in 2007,11% of black women aged 30–44 without a high school diploma had a working spouse.[47][copyright violation?] The poverty rate for native born and naturalized whites is identical (9.6%). On the other hand, the poverty rate for naturalized blacks is 11.8% compared to 25.1% for native born blacks suggesting race alone does not explain income disparity. Not all minorities have low incomes. Asian families have higher incomes than all other ethnic groups. For example, the 2005 median income of Asian families was $68,957 compared to the median income of white families of $59,124.[48] Asians, however, report discrimination occurrences more frequently than blacks. Specifically, 31% of Asians reported employment discrimination compared to 26% of blacks in 2005.[49]
- The relationship between tax rates and poverty is disputed. A study comparing high tax Scandinavian countries with the U. S. suggests high tax rates are inversely correlated with poverty rates.[50] The poverty rate, however, is low in some low tax countries such as Switzerland. A comparison of poverty rates between states reveals that some low tax states have low poverty rates. For example, New Hampshire has the lowest poverty rate of any state in the U. S., and has very low taxes (46th among all states).It is true however that in those instances, both Switzerland and New Hampshire have a very high household income and other measures to levy or offset the lack of taxation. For example, Switzerland has Universal Healthcare and a free system of education for children as young as four years old.[51] New Hampshire has no state income tax or sales tax, but does have the nation’s highest property taxes.[52]
- The conservative Heritage Foundation speculates that illegal immigration increases job competition among low wage earners, both native and foreign born. Additionally many first generation immigrants, namely those without a high school diploma, are also living in poverty themselves.[53]
Concerns regarding accuracy
In recent years, there have been a number of concerns raised about the official U.S. poverty measure. In 1995, the National Research Council‘s Committee on National Statistics convened a panel on measuring poverty. The findings of the panel were that “the official poverty measure in the United States is flawed and does not adequately inform policy-makers or the public about who is poor and who is not poor.”The panel was chaired by Robert Michael, former Dean of the Harris School of the University of Chicago. According to Michael, the official U.S. poverty measure “has not kept pace with far-reaching changes in society and the economy.” The panel proposed a model based on disposable income:
| “ | According to the panel’s recommended measure, income would include, in addition to money received, the value of non-cash benefits such as food stamps, school lunches and public housing that can be used to satisfy basic needs. The new measure also would subtract from gross income certain expenses that cannot be used for these basic needs, such as income taxes, child-support payments, medical costs, health-insurance premiums and work-related expenses, including child care.[54] | ” |
Understating poverty
Many sociologists and government officials have argued that poverty in the United States is understated, meaning that there are more households living in actual poverty than there are households below the poverty threshold.[55] A recent NPR report states that as much as 30% of Americans have trouble making ends meet and other advocates have made supporting claims that the rate of actual poverty in the US is far higher than that calculated by using the poverty threshold.[55] A study taken in 2012 estimated that roughly 38% of Americans live “paycheck to paycheck.”[56]According to William H. Chafe, if one used a relative standard for measuring poverty (a standard that took into account the rising standards of living rather than an absolute dollar figure) then 18% of families was living in poverty in 1968, not 13% as officially estimated at that time.[57]
As far back as 1969, the Bureau of Labor Statistics put forward suggested budgets for families to live adequately on. 60% of working-class Americans lived below one of these budgets, which suggested that a far higher proportion of Americans lived in poverty than the official poverty line suggested. These findings were also used by observers on the left when questioning the long-established view that most Americans had attained an affluent standard of living in the two decades following the end of the Second World War.[58][59]

As noted above, the poverty thresholds used by the US government were originally developed during the Johnson administration’sWar on Poverty initiative in 1963–1964.[61][62] Mollie Orshansky, the government economist working at the Social Security Administration who developed the thresholds, based the threshold levels on the cost of purchasing what in the mid 1950s had been determined by the US Department of Agriculture to be the minimal nutritionally-adequate amount of food necessary to feed a family. Orshansky multiplied the cost of the food basket by a factor of three, under the assumption that the average family spent one third of its income on food.
While the poverty threshold is updated for inflation every year, the basket of food used to determine what constitutes being deprived of a socially acceptable minimum standard of living has not been updated since 1955. As a result, the current poverty line only takes into account food purchases that were common more than 50 years ago, updating their cost using the Consumer Price Index. When methods similar to Orshansky’s were used to update the food basket using prices for the year 2000 instead of from nearly a half century earlier, it was found that the poverty line should actually be 200% higher than the official level being used by the government in that year.[63]
Yet even that higher level could still be considered flawed, as it would be based almost entirely on food costs and on the assumption that families still spend a third of their income on food. In fact, Americans typically spent less than one tenth of their after-tax income on food in 2000.[64] For many families, the costs of housing, health insurance and medical care, transportation, and access to basic telecommunications take a much larger bite out of the family’s income today than a half century ago; yet, as noted above,[61][62] none of these costs are considered in determining the official poverty thresholds. According to John Schwarz, a political scientist at the University of Arizona:
| “ | The official poverty line today is essentially what it takes in today’s dollars, adjusted for inflation, to purchase the same poverty-line level of living that was appropriate to a half century ago, in 1955, for that year furnished the basic data for the formula for the very first poverty measure. Updated thereafter only for inflation, the poverty line lost all connection over time with current consumption patterns of the average family. Quite a few families then didn’t have their own private telephone, or a car, or even a mixer in their kitchen… The official poverty line has thus been allowed to fall substantially below a socially decent minimum, even though its intention was to measure such a minimum. | ” |
Such fluctuations in local markets are, however, not considered in the Federal poverty threshold, and thus leave many who live in poverty-like conditions out of the total number of households classified as poor.
In 2011, the Census Bureau introduced a new supplementary poverty measure aimed at providing a more accurate picture of the true extent of poverty in the United States. According to this new measure, 16% of Americans lived in poverty in 2011, compared with 15.2% using the official figure. The new measure also estimated that nearly half of all Americans lived in poverty that year, defined as living within 200% of the federal poverty line.[67]
Duke University Professor of Public Policy and Economics Sandy Darity, Jr. says, “There is no exact way of measuring poverty. The measures are contingent on how we conceive of and define poverty. Efforts to develop more refined measures have been dominated by researchers who intentionally want to provide estimates that reduce the magnitude of poverty.”[68]
Overstating poverty

The federal poverty line also excludes income other than cash income, especially welfare benefits. Thus, if food stamps and public housing were successfully raising the standard of living for poverty stricken individuals, then the poverty line figures would not shift since they do not consider the income equivalents of such entitlements.[70]
A 1993 study of low income single mothers titled Making Ends Meet, by Kathryn Edin, a sociologist at the University of Pennsylvania, showed that the mothers spent more than their reported incomes because they could not “make ends meet” without such expenditures. According to Edin, they made up the difference through contributions from family members, absent boyfriends, off-the-book jobs, and church charity.
According to Edin: “No one avoided the unnecessary expenditures, such as the occasional trip to the Dairy Queen, or a pair of stylish new sneakers for the son who might otherwise sell drugs to get them, or the Cable TV subscription for the kids home alone and you are afraid they will be out on the street if they are not watching TV.” However many mothers skipped meals or did odd jobs to cover those expenses. According to Edin, for “most welfare-reliant mothers food and shelter alone cost almost as much as these mothers received from the government. For more than one-third, food and housing costs exceeded their cash benefits, leaving no extra money for uncovered medical care, clothing, and other household expenses.” [71]
Moreover, Swedish libertarianthink tankTimbro points out that lower-income households in the U.S. tend to own more appliances and larger houses than many middle-income Western Europeans.[72]
Fighting poverty
See also: War on poverty and Welfare’s effect on poverty
There have been many governmental and nongovernmental efforts to reduce poverty and its effects. These range in scope from neighborhood efforts to campaigns with a national focus. They target specific groups affected by poverty such as children, people who are autistic, immigrants, or people who are homeless. Efforts to alleviate poverty use a disparate set of methods, such as advocacy, education, social work, legislation, direct service or charity, and community organizing.Recent debates have centered on the need for policies that focus on both “income poverty” and “asset poverty.”[73] Advocates for the approach argue that traditional governmental poverty policies focus solely on supplementing the income of the poor, through programs such as Aid to Families with Dependent Children (AFDC) and Food Stamps. According to the CFED2012 Assets & Opportunity Scorecard, 27 percent of households – nearly double the percentage that are income poor – are living in “asset poverty.” These families do not have the savings or other assets to cover basic expenses (equivalent to what could be purchased with a poverty level income) for three months if a layoff or other emergency leads to loss of income. Since 2009, the number of asset poor families has increased by 21 percent from about one in five families to one in four families.
Additionally, the Earned Income Tax Credit (EITC or EIC) is a credit for people who earn low-to-moderate incomes. This credit allows them to get free money from productive taxpayers who must do without so the taxabsorbers can get free money. The Earned Income Tax Credit is viewed as the largest poverty reduction program in the United States.
See also


- Income in the United States
- Income inequality in the United States
- Income deficit
- Lowest-income counties in the United States
- Homelessness in the United States
- Federal assistance in the United States
- Pathways out of Poverty (POP)
- Human Poverty Index
- Mississippi Teacher Corps
- Basic Income
- Negative Income Tax
- Tipping Point Community
- Redistributive change
- De-industrialization crisis
- The Other America
- Two Americas
- Kids Against Hunger
- Can you hear their voices? (1931 play)
- Feminization of poverty
- Unintended pregnancy
- Social determinants of health in poverty
References
- ^“Census: U.S. Poverty Rate Spikes, Nearly 50 Million Americans Affected”CBS. November 15, 2012
- ^“Poverty rate hits 15-year high”Reuters. September 17, 2010
- ^“Extreme Poverty in the United States, 1996 to 2011″National Poverty Center, February 2012
- ^ ab Walker, Duncan (6 March 2013). “The children going hungry in America”. BBC News. Retrieved 13 March 2013.
- ^“US poverty on track to post record gain in 2009 – Yahoo! News”. News.yahoo.com. 2009-04-13. Retrieved 2010-09-16.
- ^ Zweig, Michael (2004) What’s Class Got to do With It, American Society in the Twenty-first Century. ILR Press. ISBN 978-0-8014-8899-3
- ^ Schwartz, J. E. (2005). Freedom reclaimed: Rediscovering the American vision. Baltimore: G-University Press.
- ^ ab2012 HHS Poverty GuidelinesU.S. Department of Health & Human Services, Accessed: 14 June 2012
- ^ Hacker, J. S. (2006). The great risk shift: The new insecurity and the decline of the American dream. New York: Oxford University Press (USA).
- ^ Savage, Sarah. “Child Poverty High in Rural America”. Retrieved 2008-08-26.
- ^Child Poverty High in Rural America Newswise, Retrieved on August 26, 2008.
- ^“Income, Poverty, and Health Insurance Coverage in the United States: 2008″. U.S. Census Bureau. September 2009.
- ^ Fisher, G.M. (2003) The Development of the Orshansky Poverty Thresholds. Accessed: 2003-12-27
- ^ abcPoverty Definition U.S. Census Bureau. Accessed: 2003-12-27.
- ^Census Bureau answer to What is the difference between poverty thresholds and guidelines?
- ^Census Bureau Poverty thresholds
- ^Census Bureau:Poverty: 2007 and 2008 American Community Surveys
- ^BPS:Miskin
- ^[1]
- ^INSEE Nombre et taux de personnes vivant sous le seuil de pauvreté selon leur âge
- ^ ab Michael Foerster/Marco Mira d’Ercole, “Income Distribution and Poverty in OECD Countries in the Second Half of the 1990s”, OECD Social, employment and migration working papers No. 22, Paris 2005, page 22, figure 6.
- ^ Bureau of Labor Statistics’ 2008 Consumer Spending Survey, Table 1 ftp://ftp.bls.gov/pub/special.requests/ce/standard/2008/quintile.txt. The reported expenditures were computed by dividing the average annual expenditures (reduced by real property, income and other taxes) by the average number of persons in the household.
- ^ Bassuk, E.L., et al. (2011) America’s Youngest Outcasts: 2010 (Needham, MA: The National Center on Family Homelessness) page 20
- ^“Homeless children at record high in US. Can the trend be reversed?”Christian Science Monitor, December 13, 2011
- ^ ab“State of the Homeless 2012″Coalition for the Homeless, June 8, 2012
- ^“600 homeless children in D.C., and no one seems to care”Washington Post, February 8, 2013
- ^ abcdef U.S. Census Bureau. Current Population Survey. People in Families by Family Structure, Age, and Sex, Iterated by Income-to-Poverty Ratio and Race: 2007: Below 100% of Poverty – All Races.
- ^ Dáil, Paula vW. (2012). Women and Poverty in 21st Century America. NC, USA: McFarland. pp. 27. ISBN 978-0-7864-4903-3.
- ^ ab U.S. Census Bureau. Current Population Survey. People in Families by Family Structure, Age, and Sex, Iterated by Income-to-Poverty Ratio and Race: 2007: Below 100% of Poverty – White Alone.
- ^ ab“Poverty 3-Part 100_06″. Pubdb3.census.gov. 2008-08-26. Retrieved 2010-09-16.
- ^ abc“Poverty 2-Part 100_09″. Pubdb3.census.gov. 2008-08-26. Retrieved 2010-09-16.
- ^“Poverty 1-Part 100_03″. Pubdb3.census.gov. 2008-08-26. Retrieved 2010-09-16.
- ^“Poverty 1-Part 100_09″. Pubdb3.census.gov. 2008-08-26. Retrieved 2010-09-16.
- ^ abc“Income, Poverty and Health Insurance Coverage in the United States: 2010“. U.S. Census Bureau
- ^“Poverty Is a Persistent Reality for Many Rural Children in U.S.“, William O’Hare (September 2009), Population Reference Bureau.
- ^“Characteristics and Financial Circumstances of TANF Recipients – Fiscal Year 2009“. United States Department of Health and Human Services.
- ^http://www.oecd.org/dataoecd/47/2/41528678.pdf
- ^“3.5M Kids Under 5 On Verge Of Going Hungry
Study: 11 Percent Of U.S. Households Lack Food For Healthy Lifestyle” (“SHTML). Health. CBS NEWS. 2009-05-07. Retrieved 2009-05-08. - ^ Doob, Christopher (2013). Social Inequality and Stratification in US Society. Upper Saddle River, New Jersey: Pearson Education Inc.. pp. 38. ISBN 978-0-205-79241-2.
- ^Household Food Security in the United States, 2002– United States Department of Agriculture
- ^Household Food Security in the United States, 2008– United States Department of Agriculture
- ^ Charles Murray (1998). Income Inequality and IQ. Washington: AEI Press.
- ^ ab“U. S. Census: Income, Expenditures, Poverty and Wealth” (PDF). Retrieved 2010-03-20.
- ^futureofchildren.org
- ^ Census Bureau, Income Poverty, and Health Insurance Coverage in the U. S.:2009 http://www.census.gov/prod/2010pubs/p60-238.pdf
- ^ Center for the Future of Children, The Future of Children. Vol. 7, No 2, 1997.
- ^“Sex and the single black woman“. The Economist. April 8, 2010.
- ^ Source: U. S. Census, Family Income Tables, http://pubdb3.census.gov/macro/032006/faminc/toc.htm.
- ^ Amy Joyce, “The Bias Breakdown,” The Washington Post, December 9, 2005, p. D01 citing Gallop Poll data.)
- ^“The Social Benefits and Economic Costs of Taxation” (PDF). Retrieved 2007-12-20.
- ^ The Swiss education system swissworld.org, Retrieved on 2009-06-23
- ^“New Hampshire’s State and Local Tax Burden, 1970–2006″. The Tax Foundation. 2008-08-07. http://www.taxfoundation.org/taxdata/show/468.html. Retrieved 2010-07-31.
- ^“Heritage Foundation’s views of immigration and poverty”. Retrieved 2007-02-25.
- ^ Harms, W. (1995) Poverty definition flawed, more accurate measure needed The University of Chicago Chronicle, 14:17.
- ^ ab Adams, J.Q.; Pearlie Strother-Adams (2001). Dealing with Diversity. Chicago, IL: Kendall/Hunt Publishing Company. ISBN 0-7872-8145-X.
- ^http://www.cbsnews.com/8301-505144_162-57477881/more-americans-live-paycheck-to-paycheck/
- ^ The Unfinished Journey: America Since World War II by William H. Chafe
- ^http://books.google.co.uk/books?id=TXdWbwEPIO0C&pg=PA482&dq=bureau+labor+statistics+1969+60%25+working-class&hl=en&sa=X&ei=Qi4fT_akHtG7hAfUz73zDQ&redir_esc=y#v=onepage&q=bureau%20labor%20statistics%201969%2060%25%20working-class&f=false
- ^http://www.thenation.com/article/155492/seventies-show?page=full
- ^http://books.google.co.uk/books?id=tPE0opidIxMC&pg=PA147&dq=Peter+Townsend+poverty+in+UK+percentage&hl=en&sa=X&ei=p2yQT9bvIcql0QW78Z34AQ&ved=0CDQQ6AEwADgK#v=onepage&q=Peter%20Townsend%20poverty%20in%20UK%20percentage&f=false
- ^ ab Fisher, Gordon M.. “The Development of the Orshansky Poverty Thresholds and Their Subsequent History as the Official U.S. Poverty Measure”. Poverty – Experimental Measures. U.S. Census Bureau. Retrieved 11 January 2012.
- ^ ab Fisher, Gordon M.. “Remembering Mollie Orshansky – The Developer of the Poverty Thresholds”. U.S. Social Security Administration Office of Retirement and Disability Policy. Retrieved 11 January 2012.
- ^ Schwarz, John E. (2005). Freedom Reclaimed: Rediscovering the American Vision. Baltimore: Johns Hopkins University. pp. 194 note 13. ISBN 0-8018-7981-7.
- ^ Clauson, Annette (September 2000). “Despite Higher Food Prices, Percent of U.S. Income Spent on Food Remains Constant”. Amber Waves (U.S. Department of Agriculture Economic Research Service).
- ^ ab“California median home price”. Retrieved 2006-07-06.[dead link]
- ^“Monterey County income distribution”. Retrieved 2006-07-06.
- ^http://www.epi.org/publication/poverty-measure-highlights-dire-circumstances/
- ^[2]
- ^ Rector, Robert; Rachel, Sheffield (July 18, 2011). “Air Conditioning, Cable TV, and an Xbox: What is Poverty in the United States Today?”. The Heritage Foundation. Retrieved July 27, 2011.
- ^Poor Poverty Yardsticks by Rea Hederman, Heritage Foundation, Washington Post. September 7, 2006. Accessed: 2007-02-18
- ^Devising New Math to Define Poverty by Louis Uchitelle, New York Times. 1999-10-18. Accessed: 2006-06-16
- ^“E.U. vs U.S.A,Timbro” (PDF). Retrieved 2007-11-10.
- ^http://assetsandopportunity.org/scorecard/
Further reading
- Caudill, Harry (1962). Night Comes to the Cumberlands. Little, Brown and Company. ISBN 0-316-13212-8.
- Harrington, Michael (1962). The Other America. Macmillan. ISBN 0-684-82678-X.
- Sarnoff, Susan; Yoon, Hong-Sik (2003). “Central Appalachia – Still the Other America”. Journal of Poverty (The Haworth Press) 7 (1 & 2): 123–139. doi:10.1300/J134v07n01_06.
- Shipler, David K. 2004. The Working Poor :Invisible in America, Knopf.
External links
- U.S. Census Bureau Poverty Definition
- U.S. Census Bureau Poverty in the United States
- Why Poverty Doesn’t Rate, American Enterprise Institute
- Social Solutions to Poverty: America’s Struggle to Build a Just Society. Scott Myers-Lipton, (2006).
- Child Poverty and Tax: a simple graph of child disposible income disparity in OECD countries against tax burdens.
- F.H.C. Ministries Charity is not Reform!
- From Poverty to Prosperity: A National Strategy to Cut Poverty in Half, The Center for American Progress, April 2007.
- Explanation of poverty definition by economist Ellen Frank in Dollars & Sense magazine, January/February 2006
- “Deciding Who’s Poor” by economist Barbara Bergmann in Dollars & Sense magazine, March/April 2000
- 37 million poor hidden in the land of plenty
- David Walls, Models of Poverty and Planned Change
- U.S. Government Does Relatively Little to Lessen Child Poverty Rates
- U.S. Department of Health & Human Services Poverty Guidelines, Research, and Measurement
- Cities Tolerate Homeless Camps by Jennifer Levitz, The Wall Street Journal, August 11, 2009
- The Forgotten Americans PBS series by Hector Galan about colonias.
- Americans living in Third World conditions This article discusses the living conditions of people inhabiting colonias (with pictures).
- Steve Suitts, “The Worst of Times: Children in Extreme Poverty in the South and Nation,”Southern Spaces, 29 June 2010.
| ||
| ||
| ||
| ||
Categories (++):
The Other America, a book by Michael Harrington, (ISBN 0-684-82678-X) was an influential study of poverty in the United States, published in 1962 by Macmillan. A widely read review, “Our Invisible Poor,” in The New Yorker by Dwight Macdonald brought the book to the attention of President John F. Kennedy. The Other America argued that up to 25% of the nation was living in poverty. Many (such as historian Maurice Isserman[1]) believe that this book is responsible for President Lyndon B. Johnson’s “War on Poverty.” The Penguin Books paperback editions have sold over one million copies.[1] The Boston Globe editorialized that Medicaid, Medicare, food stamps and expanded social security benefits were traceable to Harrington’s ideas. Harrington became the pre-eminent spokesman for democratic socialism in America.[1]
- Poverty in the United States(−)(±)
- Wealth in the United States(−)(±)
- Health in the United States(−)(±)
- (+)
The Other America
From Wikipedia, the free encyclopedia
| Part of a series on |
| Socialism in the United States |
|---|
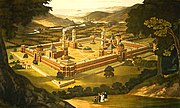 |
| Parties and organizations |
Documentary film
The 1999 documentary filmMichael Harrington and Today’s Other America: Corporate Power and Inequality captured the essence of Harrington’s ideas through the use of archival footage and interviews with his colleagues and opponents.[2] Over thirty interviews were filmed, including:- John Kenneth Galbraith
- Gloria Steinem
- William F. Buckley
- Charles Murray
- as well as ordinary people who struggle to make a living, or are dependent on social services.
- the merits and relevance of unions today
- the problems of migrant workers, farmers, and big business
- and the Americanhealth care system.
References
- ^ abcIsserman, Maurice (2009-06-19). “Michael Harrington: Warrior on poverty”. The New York Times.
- ^http://www.filmakers.com/index.php?a=filmDetail&filmID=1006
See also
 | This article about a political book is a stub. You can help Wikipedia by expanding it. |
 | This article about a political documentary film is a stub. You can help Wikipedia by expanding it. |
Two Americas
From Wikipedia, the free encyclopedia
Two Americas is a catch phrase referring to social stratification in Americansociety, made famous in a speech by former US Senator and former presidential candidate John Edwards, originally referring to haves and have-nots.[1] The speech has since become popular and inspired many parodies and similar metaphors.Contents |
Background
Although not necessarily the most prominent issue for other candidates in the seasons in which he campaigned for president, poverty has typically been a mainstay of liberal politics and a major focus for Edwards’ campaign efforts.[2] Edwards has since expanded the metaphor further, for instance in a guest blog entry in the aftermath of Hurricane Katrina:[3]| “ | During the campaign of 2004, I spoke often of the two Americas: the America of the privileged and the wealthy, and the America of those who lived from paycheck to paycheck. I spoke of the difference in the schools, the difference in the loan rates, the difference in opportunity. All of that pales today. Today … we see a harsher example of two Americas. We see the poor and working class of New Orleans who don’t own a car and couldn’t evacuate to hotels or families far from the target of Katrina. We see the suffering of families who lived from paycheck to paycheck and who followed the advice of officials and went to shelters at the Civic Center or the Superdome or stayed home to protect their possessions. | ” |
The speech
The following are excerpts from a speech given by Senator John Edwards as Democratic vice presidential nominee to the 2004 Democratic National Convention on 28 July 2004, based on the idea of Two Americas. For the complete transcript, see External links.
- “I have spent my life fighting for the kind of people I grew up with. For two decades, I stood with kids and families against big HMOs and big insurance companies. When I got to the Senate, I fought those same fights against the Washington lobbyists and for causes like the Patients’ Bill of Rights. I stand here tonight ready to work with you and John [Kerry] to make America stronger. And we have much work to do, because the truth is, we still live in a country where there are two different Americas… [applause] one, for all of those people who have lived the American dream and don’t have to worry, and another for most Americans, everybody else who struggle to make ends meet every single day. It doesn’t have to be that way…
- “We can build one America where we no longer have two health care systems: one for families who get the best health care money can buy, and then one for everybody else rationed out by insurance companies, drug companies, HMOs. Millions of Americans have no health coverage at all. It doesn’t have to be that way. We have a plan…
- “We shouldn’t have two public school systems in this country: one for the most affluent communities, and one for everybody else. None of us believe that the quality of a child’s education should be controlled by where they live or the affluence of the community they live in. It doesn’t have to be that way. We can build one school system that works for all our kids, gives them a chance to do what they’re capable of doing…
- “John Kerry and I believe that we shouldn’t have two different economies in America: one for people who are set for life, they know their kids and their grand-kids are going to be just fine; and then one for most Americans, people who live paycheck to paycheck…
- “So let me give you some specifics. First, we can create good-paying jobs in this country again. We’re going to get rid of tax cuts for companies who are outsourcing your jobs… [applause] and, instead, we’re going to give tax breaks to American companies that are keeping jobs right here in America…
- “Well, let me tell you how we’re going to pay for it. And I want to be very clear about this. We are going to keep and protect the tax cuts for 98 percent of Americans — 98 percent. We’re going to roll back — we’re going to roll back the tax cuts for the wealthiest Americans. And we’re going to close corporate loopholes…
Other applications
Edwards later revisited the Two Americas theme frequently in his 2008 presidential election campaign.See also
- Poverty in the United States
- The Other America
- Cross of Gold speech
- I Have a Dream
- Read my lips: no new taxes
- One Nation Conservatism
References
External links
- The original speech from the 2004 Democratic National Convention
- A stump speech using the metaphor
- A 2007 campaign ad explaining the Two Americas concept
| [hide] | ||
|---|---|---|
On the Bowery
From Wikipedia, the free encyclopedia
| On the Bowery | |
|---|---|
 Film poster | |
| Directed by | Lionel Rogosin |
| Produced by | Lionel Rogosin |
| Written by | Mark Sufrin (uncredited) |
| Starring | Gorman Hendricks, Frank Matthews, Ray Salyer |
| Music by | Charles Mills |
| Cinematography | Richard Bagley (uncredited) |
| Editing by | Carl Lerner |
| Distributed by | Milestone Films |
| Release date(s) |
|
| Running time | 65 minutes |
| Country | United States |
| Language | English |
After the Second World War Lionel Rogosin made a vow to fight fascism and racism wherever he found it. In 1954 he left the family business (Beaunit Mills-American Rayon Corp.) in order to make films in accordance with his ideals. As he needed experience, he looked around for a subject and was struck by the men on the Bowery and decided that this would make a strong film. Thus On the Bowery was to be Rogosin’s provocative film school that would prepare him for the filming of his anti-apartheid film: Come Back, Africa (1960).
In 2008, On the Bowery was selected for preservation in the United States National Film Registry by the Library of Congress as being “culturally, historically, or aesthetically significant”.
Contents |
Filming
Greatly influenced by Robert Flaherty and Italian neorealism tradition, Rogosin submerged himself on the Bowery for many months before filming. He got to know the street and the men intimately, befriending a Bowery man: Gorman Hendricks. Together they wandered through the Bowery for several months until Rogosin started filming himself with a hidden camera. Not satisfied with the result he then hired a commercial crew but decided that these attempts were not satisfactory. At this time he was living in New York City’s Greenwich Village and he frequently went to the White Horse Tavern where he met writer Mark Sufrin and cinematographer Dick Bagley (recently part of the crew of Sydney Myers The Quiet One). They got along right away and agreed to work with Rogosin. Shooting began with no script or story in July 1955. The first rushes were not working well, so that Rogosin, Sufrin and Bagley worked out a simple script based on the lives of the Bowery men.In July 1955 Rogosin and his crew started filming. With these Bowery men, Rogosin quickly developed his own method of creating dialogue and improvisation. The filming continued through October 1955 in a grueling schedule of long days and late nights. When the film was finished the first edit with editor Helen Levitt did not meet Rogosin’s approval and he solicited the help of Carl Lerner. Lerner was instrumental in pulling the film together according to Rogosin’s vision and acted as a mentor and editor as Rogosin learned this aspect of his craft.
Plot
The film chronicles three desperate days in a then impoverished lower Manhattan neighborhood, New York’s skid row: the Bowery. It is the story of Ray, a railroad worker, who drifts on to the Bowery to have a drunken spree after a long bout of laying tracks and then falls in with a band of drunks who help him spend his money. Ray, the “new guy on the Bowery,” whose biceps still fill out his sleeves, looks preoccupied as he enters the “Confidence Bar & Grill”. Surrounded by various alcoholics in advanced states of decay, he buys them rounds of drinks, then blacks out on his first night, and wakes up to discover that his suitcase has been stolen. The thief will become the closest thing to a friend…and just like that, Ray embarks on a trip to hell, becoming part of the Bowery. In a series of Beckettian portraits, the protagonists, congregations of winos, listless listeners, blubber through numerous bar scenes, games of dominos around a flophouse stove, and a sermon at the Bowery Mission. Will Ray find his way out of this uncaring urban jungle?Cast
- Ray Salyer, the lead character in the film, was offered a Hollywood contract but chose to remain on the Bowery.
- Gorman Hendricks died weeks after the film opened. Rogosin helped both men and took care of Hendricks’ burial.
Crew
- Dick Bagley
- Mark Sufrin
- Carl Lerner edited Rogosin’s second film Come Back, Africa
- Darwin Deen, Assistant Cameraman and Second Camera Operator
Reception
In September 1956, Rogosin became the first American director to win the Best Documentary award at the Venice Film Festival with “On The Bowery.” Attacked by Bosley Crowther in the New York Times and shunned by the American Ambassador to Italy Claire Boothe Luce at the Venice Festival, Rogosin found support with the Flaherty family and many favorable reviews. In 1957, “On the Bowery” opened at the 55th Street Playhouse in New York, and was nominated for an Academy Award. Despite this success, distribution was extremely difficult. With On The Bowery, Rogosin became one of the founding fathers in the development of Independent cinema in America, along with Sydney Myers and Morris Engel. On the Bowery would become an influence to many future independent filmmakers worldwide.“..a film made from the inside…In the bars and on the sidewalks, the camera leans sympathetically across table or grating towards these men and women who have passed the point of no return, and have reached a hideous sort of happiness achieved at best by gin and whiskey, and at worst by a shared squeeze from a can of metal polish. We are with these people and we hear what they say. And Rogosin insists that we must love them; he seems to say, with Dostoyevsky, “the sense of their own degradation is as essential to those reckless unbridled natures as the sense of their own generosity.” —Basil Wright, Sight and Sound
“…brilliantly revealing photography by Richard Bagley matched to the patient, thoughtful construction and organization of director-producer Lionel Rogosin and writer Mark Sufrin…what stays in your mind permanently, striking you like a hammer when you first see it, is the face of the Bowery…the caked filth, the stubble beard, the clothes of eternity, the physical weakness and the shambling walk, and the unmistakable brand of liquor…” —Arthur Winston, New York Post
“…an extraordinary, agonizing document…filled with an overwhelming sense of veracity and an unvoiced compassion for the men who have surrendered their dignity for a drink” —Arthur Knight, Saturday Review
“This film, without the pity that secretly insults, without the disgust that indirectly compliments, studies its subjects with honest human interest, tries to see what they see in their lives, tries to find what they find in the bottom of the bottle.” —Time Magazine
Home media
Milestone Films released On the Bowery on DVD and Blu-ray in 2012.[2]Awards
- Grand Prize in the Documentary and short film Category, Venice Film Festival, 1956
- British Film Academy Award, “The Best Documentary of 1956”
- The Robert Flaherty Award 1957
- Nominated for an Academy Award 1957[3]
- Gold Medal Award, Sociological Convention, University of Pisa 1959
- Selected as one of the “Ten Best Movies of Ten Years Between 1950-59” by Richard Griffith, Museum of Modern Art Film Library
- Festival of Popoli, 1971
Quotes
“Making ‘On the Bowery’ taught me a method of molding reality into a form that could touch the imagination of others. The total reality of a community or a society is so vast that any attempt to detail its entirety would result in nothing more than a meaningless catalogue of stale, factual representation—-a result which I call ‘documentary.’ Flaherty’s great work has no more to do with ‘documentary’ than great poetry has to do with the factual report of a sociologist.” Lionel Rogosin“To tell the truth as you see it, incidentally, is not necessarily the truth. To tell the truth as someone else sees it is, to me, much more important and enlightening. Some documentaries are fantastic. Like Lionel Rogosin’s pictures, for instance; like “On the Bowery”. This is a guy who’s probably the greatest documentary filmmaker of all time, in my opinion.” John Cassavetes
“On The Bowery” was restored in 2006 from the original negatives by the Cineteca di Bologna and the laboratory L’Immagine Ritrovato, in cooperation with Rogosin Heritage Inc.
References
- ^ Crowther, Bosley. “On the Bowery”. The New York Times. Retrieved 2008-11-08.
- ^ Kehr, Dave. “Out of the Bowery’s Shadows (Then Back In)”. The New York Times. Retrieved 2012-11-08.
- ^“The 30th Academy Awards (1958) Nominees and Winners”. oscars.org. Archived from the original on 6 July 2011. Retrieved 2011-08-21.
External links
- Milestone Films’ On the Bowery website
- On the Bowery at Film Forum, (November 2010)
- Review by Bill Weber on September 14, 2010 (Slant Magazine)
- On the Bowery / Good Times, Wonderful Times– Article by Nick Bradshaw (Sight and Sound review, BFI)
- Lionel Rogosin: Making reality exciting and meaningful– Essay by Ntongela Masilela (Pitzer College)
- On the Bowery at the Internet Movie Database
Categories (++):
- 1956 films(−)(±)
- English-language films(−)(±)
- American films(−)(±)
- Black-and-white documentary films(−)(±)
- Films directed by Lionel Rogosin(−)(±)
- American documentary films(−)(±)
- Docufiction films(−)(±)
- Documentary films about poverty(−)(±)
- United States National Film Registry films(−)(±)
- 1950s documentary films(−)(±)
- Films shot in New York City(−)(±)
- Films about alcoholism(−)(±)
- (+)
Navigation menu
Socialism for the rich and capitalism for the poor
From Wikipedia, the free encyclopedia
Socialism for the rich and capitalism for the poor is a classical political-economic argument, stating that in the advanced capitalist societies state policies assure that more resources flow to the rich than to the poor, for example in form of transfer payments. The term corporate welfare is widely used to describe the bestowal of favorable treatment to particular corporations by the government. One of the most commonly raised forms of criticism are statements that the capitalist political economy toward large corporations allows them to “privatize profits and socialize losses.”[1] The argument has been raised and cited on many occasions.Contents |
History and usage
 | The examples and perspective in this article deal primarily with the United States and do not represent a worldwide view of the subject. Please improve this article and discuss the issue on the talk page. (March 2011) |
Andrew Young has been cited for calling the United States system “socialism for the rich and free enterprise for the poor”, and Martin Luther King, Jr. frequently used this wording in his speeches.[5][6] Since at least 1969, Gore Vidal used the expression “free enterprise for the poor and socialism for the rich” to describe the U.S. economic policies,[7][8] and he used it from the 1980s in his critiques of Reagonomics.[9]
In winter 2006/2007, in response to criticism about oil imports from Venezuela, that country being under the leadership of Hugo Chávez, the founder and president of Citizens Energy Corporation Joseph P. Kennedy II countered with a critique of the U.S. system which he characterized as “a kind of socialism for the rich and free enterprise for the poor that leaves the most vulnerable out in the cold”.[10] Also Robert F. Kennedy, Jr. has become known for expressing to large audiences that the United States is now a land of “socialism for the rich and brutal capitalism for the poor”.[11]
Economist Dean Baker expressed similar views in his book The Conservative Nanny State: How the Wealthy Use the Government to Stay Rich and Get Richer, in which he pointed out several different policy areas in which government intervention is essential to preserving and enhancing wealth in the hands of a few.[12]
Linguist Noam Chomsky has criticized the way in which free market principles have been applied. He has argued that the wealthy use free-market rhetoric to justify imposing greater economic risk upon the lower classes, while being insulated from the rigours of the market by the political and economic advantages that such wealth affords.[13] He remarked, “the free market is socialism for the rich—[free] markets for the poor and state protection for the rich.”[14]
Arguments along a similar line were raised in connection with the financial turmoil in 2008. With regard to the federal takeover of Fannie Mae and Freddie Mac, Ron Blackwell, chief economist of AFL-CIO, used the expression “Socialism for the rich and capitalism for the poor” to characterize the system.[15] In September 2008, the US Senator from Vermont, Democratic SocialistBernie Sanders said regarding the bailout of the U.S. financial system: “This is the most extreme example that I can recall of socialism for the rich and free enterprise for the poor”.[16] The same month, economist Nouriel Roubini stated: “It is pathetic that Congress did not consult any of the many professional economists that have presented […] alternative plans that were more fair and efficient and less costly ways to resolve this crisis. This is again a case of privatizing the gains and socializing the losses; a bailout and socialism for the rich, the well-connected and Wall Street”.[17]
Former U.S. Secretary of LaborRobert Reich adapted this phrase on The Daily Show on October 16, 2008: “We have socialism for the rich, and capitalism for everyone else.”[18]
Journalist John Pilger included the phrase in his speech accepting Australia‘s human rights award, the Sydney Peace Prize, on 5th November 2009: “Democracy has become a business plan, with a bottom line for every human activity, every dream, every decency, every hope. The main parliamentary parties are now devoted to the same economic policies – socialism for the rich, capitalism for the poor – and the same foreign policy of servility to endless war. This is not democracy. It is to politics what McDonalds is to food.”[19]
U.S. SenatorBernie Sanders referenced the phrase during his eight-and-a-half-hour speech on the senate floor on December 10, 2010 against the continuation of Bush-era tax cuts, when speaking on the federal bailout of major financial institutions at a time when small-businesses were being denied loans. [20]
Variations
- Privatize profits/gains, and socialize risks/losses/debts
- Markets, free enterprise, private enterprise, and capitalism for the poor, while state protection and socialism for the rich
See also
- Business ethics
- Concentrated benefits and diffuse costs
- Corporate welfare
- Crony capitalism
- Economic interventionism
- Ethical consumerism
- Iron triangle (US politics)
- Lemon socialism
- Market failure
- Neoliberalism
- Neopatrimonialism
- Plutarchy
- Plutocracy
- Privatizing profits and socializing losses
- Regulatory capture
- Right-wing socialism
- Social cost
- The rich get richer and the poor get poorer
- Too big to fail
- Trickle-down economics
Notes
- ^Stealth Public Bailout of Countrywide: Privatize profits and socialize losses, Nouriel Roubini
- ^ Harrington 1962, p.170, quote: “socialism for the rich and private enterprise for the poor”
- ^ Robert P. Engvall (1996) The connections between poverty discourse and educational reform: When did “Reform” become synonymous with inattention? in The Urban Review Volume 28, Number 2 / June, 1996, pp. 141-163
- ^Michael Harrington (1962) The Other America, p.58, quote: This is yet another case of “socialism for the rich and free enterprise for the poor,” as described by Charles Abrams in the housing field
- ^King’s Light, Malcolm’s Shadow, January 18, 1993
- ^ Thomas F. Jackson, Martin Luther King: From Civil Rights to Human Rights: Martin Luther King, Jr., and the Struggle for Economic Justice, ISBN 0-8122-3969-5, ISBN 978-0-8122-3969-0, page 332
- ^ Gore Vidal: Reflections Upon a Sinking Ship, Little, Brown, 1969
- ^ Gore Vidal: Imperial America, September 1, 2004
- ^‘Free enterprise for the poor, socialism for the rich’: Vidal’s claim gains leverage, irishtimes.com, September 20, 2008
- ^Kennedy: U.S. oil companies profit; Citgo helps the poor, MetroWest Daily News, January 24, 2007
- ^ Mark Jacobson: American Jeremiad, New York Magazine, February 5, 2007, see page 4
- ^ Baker, Dean (2006). The Conservative Nanny State: How the Wealthy Use the Government to Stay Rich and Get Richer. Washington, D.C.: Center for Economic and Policy Research. ISBN 1-4116-9395-7. Reviewed in: Scott Piatkowski: Socialism for the rich, http://www.rabble.ca, May 25, 2006
- ^ Takis Michas, “The Other Chomsky”, Wall Street Journal, November 4, 2005. Reproduced on Chomsky’s official site.
- ^ Noam Chomsky, “The Passion for Free Markets”, Z Magazine, May 1997. Reproduced on Chomsky’s official site.
- ^Fannie/Freddie’s “Socialism for Rich”, July 15, 2008
- ^Sanders Op-Ed: Billions for Bailouts! Who Pays?, September 19, 2008
- ^Nouriel Roubini: Nouriel Roubini’s Global EconoMonitor, September 28, 2008
- ^ Interview with Jon Stewart, The Daily Show, Oct 16, 2008: Available at The Daily Show Site
- ^ Full transcript of the John Pilger speech at the Sydney Opera House to mark his award of Australia’s human rights prize, the Sydney Peace Prize: [1]
- ^http://www.c-span.org/Events/Sen-Sanders-Held-a-Tax-Cut-Filibuster/20338/
References
- Harrington, Michael (1962). The Other America. Macmillan. ISBN 0-684-82678-X.
- Ralph NaderWelfare for the Rich New York Times Op-Ed, May 15, 1999
- Noam Chomsky, How Free is the Free Market?Resurgence no. 173. November-December 1995
- Peter McLaren and Ramin Farahmandpur Reconsidering Marx in Post-Marxist Times: A Requiem for Postmodernism? Educational Researcher, Vol. 29, No. 3 (Apr., 2000), pp. 25-33
- Coontz, Stephanie (1995) The American Family and the Nostalgia Trap. KAPPAN Special Report. Phi Delta Kappan, v76 n7 pK1-K20 Mar 1995
- Reich, Michael (1972). “Does the U.S. Economy Require Military Spending?”. American Economic Review (American Economic Association) 62 (1–2): 296–303. JSTOR 1821555.
- What will real economic change look like? August 1, 2008 The Real News
- The U.S. Economy Is Socialism for the Rich
- Joel Bakan (2004) Corporation: The Pathological Pursuit of Profit and Power, Free Press, 2004 p. 151Distribution of wealth
Skid row
From Wikipedia, the free encyclopedia
For other uses, see Skid row (disambiguation).


Contents |
Origins
The term “skid road” dates back to the 17th century, when it referred to a log road, used to skid or drag logs through woods and bog.[3] The term was in common usage in the mid-19th century and came to refer not just to the corduroy roads themselves, but to logging camps and mills all along the Pacific Coast.[6]The source of the term “skid road” as an urban district is heavily debated, and is generally identified as originating in either Seattle or Vancouver.[3] One job on the skid road was lubricating it to make the logs slide more easily. The person with that job was called the “grease monkey”,[7] predating, and probably giving rise to the modern usage of grease monkey as a mechanic.
Seattle
The name “Skid Road” was in use in Seattle by 1865 when the city’s historic Pioneer Square neighborhood began to expand from its commercial core.[8] The district centered near the end of what is now Yesler Way, often said to have been the original “Skid Road” in the literal sense serving a saw mill owned by Henry Yesler.Henry Yesler acquired land from Doc Maynard at a small point of land at what is today near the intersection of 1st Ave and Yesler Way. He also acquired a swath of land 450 feet wide from his property up First Hill to a box of land about 10 acres in size full of timber spanning what is today 20th to 30th Avenues. His steam-powered logging mill was built in 1853[8] on the point of land that looked south towards a small island (Denny’s Island, part of his land purchase from Doc Maynard) that has since been filled in around and is the heart of today’s Pioneer Square. The mill operated seven days a week, 24 hours per day on the waterfront.[8] The street’s end near the mill, attracted cookhouses and inexpensive hotels for itinerant workers, along with several establishments that served beer and liquor.[8]
The Skid Road was built on that 450 foot wide slice of land from the top of First Hill to the logging mill on the point. Timber cut in nearby forests was greased and skidded down a long, steeply sloping dirt road.[8] Since the building of the mill much of what is today’s Seattle is the result of extensive terra-forming by the local people to make the hilly landscape of Seattle habitable. At the time of the building of the mill it was some of the only flat land available. The Skid Road became the demarcation line between the affluent members of Seattle and the mill workers and more rowdy portion of the population.[9] The road became Mill Street, and eventually Yesler Way, but the nickname “Skid Road” was permanently associated with the district at the street’s end.[8]
Vancouver
Main article: Downtown Eastside
The 100-block of East Hastings Street in Vancouver, British Columbia, the heart of that city’s “skid road” neighborhood, lies on a historical skid road. The Vancouver Skid Road was part of a complex of such roads in the dense forests surrounding the Hastings Mill and adjacent to the settlement of Granville, Burrard Inlet (Gastown).[10]The city began as a sawmill settlement called Granville, in the early 1870s.[11] By at least the 1950s, “Skid Road” was commonly used to describe the more dilapidated areas in the city’s Downtown Eastside,[12] which is focused on the original “strip” along East Hastings Street due to a concentration of single room occupancy hotels (SROs) and associated drinking establishments in the area. The area’s seedy origins date back to the early concentration of saloons in pre-Canadian Prohibition (1915–1919) and its popularity with loggers, miners and fishermen whose work was seasonal and who spent their salaries in the area’s cheap accommodations and public houses.
Opium and heroin use became popular early on; Vancouver was for many years the main port-of-entry for the North American opium supply. During the Great Depression, the railway rights-of-way and other vacant lots in the area were thronged by the unemployed and poor, and the pattern of social decay became well-established. In the 1970s, the endemic alcohol and poverty problems in the area were exacerbated by the expansion of the drug trade, with crack cocaine becoming high-profile in the 1980s as well as a reconcentration of the prostitution trade in the area because of the relocation of hooker strolls in conjunction with city policy for Expo 86.
A portion of Vancouver’s Skid Row, Gastown, has also been gentrified; however it is in a difficult coexistence with the nearby impoverished Downtown Eastside along East Hastings Street. Downtown Eastside is infamous for its open drug trade, drug-related deaths (Vancouver’s Skid Row has the highest per capita heroin-related deaths in the entire North American continent), prostitution and the highest rate of HIV and Hepatitis C infection in North America.[citation needed]
The poorest urban area in Canada,[13] it is wedged between Downtown, Chinatown and Gastown. These areas are frequented by tourists, and East Hastings Street is a major thoroughfare. These avenues of exposure make the Downtown Eastside a highly visible example of a skid row. The Downtown Eastside (sometimes abbreviated D.T.E.S.) is also home to Insite, the only legal intravenous drug safe injection site in North America, part of a harm reduction policy aimed at helping the area’s drug addicted residents.
Los Angeles
Main article: Skid Row, Los Angeles, California
Los Angeles’s Skid Row in an area of Downtown Los Angeles, formally known as Central City East, has one of the largest stable populations of transient persons (homeless) in the United States.[citation needed] Local homeless count estimates have ranged from 3,668 to 5,131. In 2011, the homeless population estimate for Los Angeles’ Skid Row was 4,316.[14] L.A.’s Skid Row is sometimes called “the Nickel”, referring to a section of Fifth Street.[15]Several of the city’s homeless and social-service providers (such as Weingart Center Association, Volunteers of America, Frontline Foundation, Midnight Mission, Union Rescue Mission and Downtown Women’s Center) are based in Skid Row. While downtown Los Angeles has experienced a recent revitalization, developers have mostly neglected Skid Row.[citation needed] Between 2005 and 2007, several local hospitals and suburban law-enforcement agencies were accused by Los Angeles Police Department and other officials of transporting those homeless people in their care to Skid Row.[16][17]
The name Skid Row is sufficiently official that the fire apparatus at LAFD Fire Station # 9, the fire station that serves the neighborhood, have historically[when?] had “Skid Row” emblazoned on their sides.[citation needed] On 1 June 2006, the Los Angeles Times reported[citation needed] that fire officials plan to change the legend on the vehicles to read “Central City East”. Many residents support the change, but it is opposed by firefighters and some residents who take pride in the sense that they live in a tough place.[18]
In recent years, the Safer City Initiative set to clean up Skid Row was enacted by the city and police department and has resulted in dramatic changes in the area.[19]
San Francisco

Main article: Tenderloin, San Francisco
The Tenderloin neighborhood is a small, dense neighborhood near downtown San Francisco. In addition to its history and diverse and artistic community, there is significant poverty, homelessness, and crime.[20]It is known for its immigrant populations, single room occupancy hotels, ethnic restaurants, bars and clubs, alternative arts scene, large homeless population, public transit and close proximity to Union Square, the Financial District, and Civic Center.[20] The 2000 census reported a population of 28,991 persons, with a population density of 44,408/mi² (17,146/km²), in the Tenderloin’s 94102 Zip Code Tabulation Area, which also includes the nearby Hayes Valley neighborhood.[21]
During the 1960s, when development interests and the Redevelopment Agency were using eminent domain to clear out a large area populated by retired men in the South of Market area, that area was termed “Skid Row” in the media. The City’s convention center was built after the clearing of long term low-income residents.[22][23]
New York
In New York, Skid Row was a nickname given to the Bowery during much of the 20th century.[24]Chicago
Traditonal Skid Row areas in Chicago were centered along West Madison Street just west of the Chicago River and, to a lesser degree, North Clark Street just north of the Chicago River. Since the 1980s both of these areas have been gentrified.Philadelphia
Philadelphia once had a highly visible skid row centered on Vine Street, just west of the approaches to the Benjamin Franklin Bridge. This area was essentially obliterated by highway construction starting in the late 1970s.Popular references
- ‘Skidrow’ is the title of a playable multiplayer map in the video game Call of Duty: Modern Warfare 2. Its design takes a very similar appearance to a typical skid row.
- The term was memorialized in the song “Skid Row” from the musical Little Shop of Horrors.
- “Skid Row” is the name of an American heavy metal band formed in New Jersey.
- “Skid Row” is also the name of a Dublin, Ireland-based blues-rock band from the late 1960s and early 1970s that included such musicians as singer Phil Lynott and guitarist Gary Moore, both who later were part of Thin Lizzy.
- Kurt Cobain, playing in a band that at the time had no name, came up with the name “Skid Row” to put on the marquee at a gig on the spur of the moment. That band’s name would change frequently after that. He would later go on to form Nirvana.[25]
- SKiDROW is one of the prominent warez groups in software. Whether this is based on the band is unknown.
- In the 1976 film Rocky, the title character grows angry when finding out that his gym locker has been given to another boxer. He asks the attendant, “You put my stuff on Skid Row?”
- In Donkey Kong Country 3: Dixie Kong’s Double Trouble, there’s a level called “Skidda’s Row”, which derives its name from Skid Row.
See also
References
Notes
- ^ Random House Dictionary, Random House, Inc.. “Skid row”. Dictionary.com. Retrieved 15 January 2013.
- ^ The American Heritage® Dictionary of the English Language, Fourth Edition. “Skid road”. The Free Dictionary by Farlex.
- ^ abc Turner, Wallace (December 2, 1986). “A Clash Over Aid Effort on the First ‘Skid Row’”. The New York Times. p. A20.. Convenience link on Proquest (requires account).
- ^“National Register Information System”. National Register of Historic Places. National Park Service. 2010-07-09.
- ^“Portland’s History”. Retrieved 2011-10-09.
- ^ Rochester, Junius; Walt Crowley (October 17, 2002). “Yesler, Henry L. (1810-1892)”. History Ink.. Retrieved 2007-01-27.
- ^“Using Oxen to move the Redwoods on the Mendocino coast”. Retrieved 2012-07-31.
- ^ abcdef Keniston-Longrie, Joy (2009). Seattle’s Pioneer Square. Chicago, San Francisco, & Charleston, SC: Arcadia Publishing. pp. 128. ISBN 978-0-7385-7144-7.
- ^ William C. Speidel, “Sons of the Profits, The Seattle Story 1851 to 1901″
- ^“Gastown”. Virtual Vancouver. Retrieved 2008-02-10.
- ^“About Vancouver”. City of Vancouver. 2007. Retrieved 2007-01-27.
- ^“Demolish City’s Skid Road, Murder Protest Demands.” Vancouver Sun. April 6, 1962. p. 1.
- ^ Kalache, Stefan (January 12, 2007). “The Poorest Postal Code Vancouver’s Downtown Eastside in Photos”. The Dominion. Retrieved 2007-10-15.
- ^“2011 Greater Los Angeles Homeless Count (page 38 — Skid Row section)”. Los Angeles Homeless Services Authority. Retrieved 2011-11-16.
- ^“For Some, L.A.’s Skid Row Is For Beginnings”. NPR. Retrieved 2009-09-21.
- ^“LA Downtown News Online”. Downtownnews.com. Retrieved 2009-09-21.
- ^“A Plan to Spread Homeless Countywide – Los Angeles Times”. Latimes.com. 2006-03-24. Retrieved 2009-09-21.[dead link]
- ^“Fire Station 9 Skid Row”. Fire Station 9 Skid Row. 2006-06-01. Retrieved 2009-09-21.
- ^The Reclamation of Skid Row by Heather Mac Donald, City Journal Autumn 2007. City-journal.org (2007-11-07). Retrieved on 2012-09-16.
- ^ abThe Sidewalks of San Francisco by Heather Mac Donald, City Journal Autumn 2010. City-journal.org (2010-10-14). Retrieved on 2012-09-16.
- ^ American FactFinder, United States Census Bureau. “941 3-Digit ZCTA by 5-digit ZIP Code Tabulation Area – GCT-PH1. Population, Housing Units, Area, and Density: 2000″. Factfinder.census.gov. Retrieved 2009-09-21.
- ^ Hartman, Chester. 1984. The Transformation of San Francisco. Totowa, NJ: Rowman & Allanheld.
- ^ Averbach, Alvin. 1973. “San Francisco’s South of Market District, 1858-1958: The Emergence of a Skid Row.” California Historical Quarterly 52(3):196223.
- ^ Jesse McKinley (2002-10-13). “Along the Bowery, Skid Row Is on the Skids”. The New York Times. Retrieved 2010-04-06.
- ^Who killed Kurt Cobain, Chapter 2. Books.google.com. Retrieved 2009-09-21.
Bibliography
- Holbrook, Stewart H. (1961). Yankee Loggers. New York: International Paper Company.
- Newell, Gordon (1956). Totem Tales of Old Seattle. Seattle: Superior Publishing Company.
- Morgan, Murray (1960). Skid Road. Ballantine Books (revised edition; first edition was 1951).
External links
- Some Seattle history
- Pioneer Square history
- Guardian Article
- Down On Skid Row, A Tape’s Rolling! Special Documentary produced by Twin Cities Public Television
- A group page for Portland, Oregon’s “Felony Flats”
- Yelp review page for Portland’s “Felony Flats”
- Article from 2008 on gentrification in Portland’s “Felony Flats”
- Opinion column from a Portland cab driver on “Felony Flats”
Welfare dependency
From Wikipedia, the free encyclopedia
Welfare dependency is the state in which a person or household is reliant on government welfare benefits for their income for a prolonged period of time, and without which they would not be able to meet the expenses of daily living. The United States Department of Health and Human Services defines welfare dependency as the proportion of all individuals in families which receive more than 50 percent of their total annual income from Temporary Assistance for Needy Families (TANF), food stamps, and/or Supplemental Security Income (SSI) benefits.[1] Typically viewed as a social problem, it has been the subject of major welfare reform efforts since the mid-20th century, primarily focused on trying to make recipients self-sufficient through paid work. While the term “welfare dependency” can be used pejoratively, for the purposes of this article it shall be used to indicate a particular situation of persistent poverty.Contents |
- …and I am Sid Harth @elcidharth
![photo1]()

Older posts